为什么pandas有两个绘制箱线图的函数: pandas.DataFrame.plot.box() 和 pandas.DataFrame.boxplot() ?df = pd.DataFrame(np.random.rand(10, 5), columns=['A', 'B', 'C', 'D', 'E'])
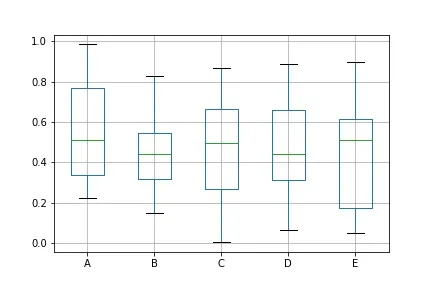
 df.plot.box() df.boxplot()
两种方法都返回一个'matplotlib.axes._subplots.AxesSubplot'对象。显然,它们调用不同的pandas库的部分来执行。其中一个后果是,pandas.DataFrame.plot.box()方法使用FramePlotMethods类,其中“grid = None”,而pandas.DataFrame.boxplot()默认情况下具有“grid = True”。您将在两个图表的背景线中注意到这一点。此外,.boxplot()不能用于Series,而.plot()可以用于Series。
df.plot.box 不接受 column 关键字参数 to_plot = pd.DataFrame(np.random.rand(10, 5), columns=['A', 'B', 'C', 'D', 'E']) # This line will error: # to_plot.plot.box(column='B') # This line will not error, will work: to_plot.boxplot(column='B')