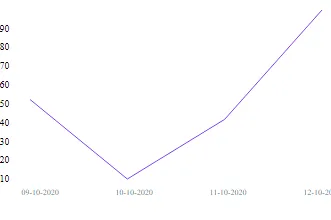
我尝试过对X轴进行格式化,以按顺序显示日期,但仍然有些点没有显示。以下是查看图表并进行编辑的链接-https://snack.expo.io/@anushkas/4cfb05。
第一个标签应该是“2020年09月10日”,但显示为“10-2020”。我正在使用react-native-svg-charts库。
import React from 'react';
import {LineChart, XAxis, YAxis} from 'react-native-svg-charts';
import {View, Text} from 'react-native';
import {Svg, Line, Circle, G, Rect} from 'react-native-svg';

export default class CustomLineChartOne extends React.PureComponent {
  handleFill = (value) => {
    if (value > 100) {
      return 'rgba(190, 30, 45, 0.5)';
    } else if (value > 80 && value <= 100) {
      return 'yellow';
    } else {
      return '#CCE6D0';
    }
  };

  render() {
    const xAxisLabels = [
      '09-10-2020',
      '10-10-2020',
      '11-10-2020',
      '12-10-2020',
    ];
    const data = [50, 10, 40, 95];

    const Decorator = ({x, y, data}) => {
      return data.map((value, index) => (
        <View>
          <Rect
            x={x(index) - 1.75}
            y={y(value + 8)}
            width="4"
            height="40"
            rx="2"
            fill={this.handleFill(value)}
          />
          <Circle
            key={index}
            cx={x(index)}
            cy={y(value)}
            r={2}
            stroke={'#639123'}
            fill={'#606060'}
          />
        </View>
      ));
    };

    return (
      <View
        style={{
          height: 200,
          flexDirection: 'row',
        }}>
        <YAxis
          data={data}
          contentInset={{top: 20, bottom: 20}}
          svg={{
            fill: 'black',
            fontSize: 10,
          }}
        />
        <View style={{flex: 1}}>
          <LineChart
            style={{flex: 1}}
            data={data}
            svg={{stroke: 'rgb(134, 65, 244)'}}
            contentInset={{top: 10, bottom: 10, left: 10, right: 10}}>
            <Decorator />
          </LineChart>
          <XAxis
            data={data}
            formatLabel={(value, index) => xAxisLabels[index]}
            contentInset={{ left: 10, right: 10 }}
            svg={{ fontSize: 8, fill: '#3A8F98' }}
          />
        </View>
      </View>
    );
  }
}