Chartjs仅显示第一个和最后一个x轴标签

5

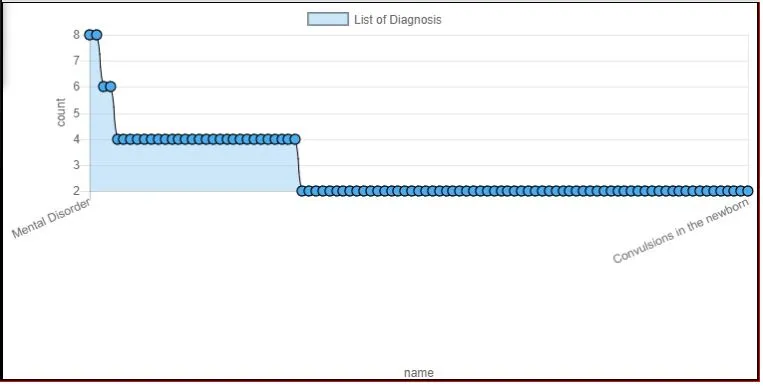
我有一个数据集,其中大约有60个x轴标签。我的折线图没有显示所有x轴标签。

        var ctx = this.refs.basicXYChart;
        var config = {
            type: 'line',
            data: {
                xLabels: Object.keys(result),
                yLabels: Object.values(result),
                datasets: [{
                    label: this.state.report.definition.name,
                    data: Object.values(result),
                    backgroundColor: 'rgba(154, 208, 245, 0.5)',
                    borderWidth: 1,
                    pointStyle: 'circle',
                    pointBackgroundColor: 'rgb(77, 172, 237)',
                    pointRadius: 5,
                    pointHoverRadius: 10,
                    borderWidth: 1,
                    borderColor: '#000000'

                }]
            },
            options: {
                scales: {
                    xAxes: [{
                        display: true,
                        scaleLabel: {
                            display: true,
                            labelString: this.props.X_label
                        }
                    }],
                    yAxes: [{
                        position: 'left',
                        display: true,
                        scaleLabel: {
                            display: true,
                            labelString: this.props.Y_label
                        }
                    }]
                }
            }
        };

        if(y_type == 'category'){
            config.options.scales.yAxes[0]['type'] = 'category';
        }
        var myChart = new Chart(ctx, config);

图片描述在此处输入

我还希望将y轴从0开始

1个回答

5

这是过时的信息。 - marvinfrede

网页内容由stack overflow 提供, 点击上面的
可以查看英文原文,
原文链接