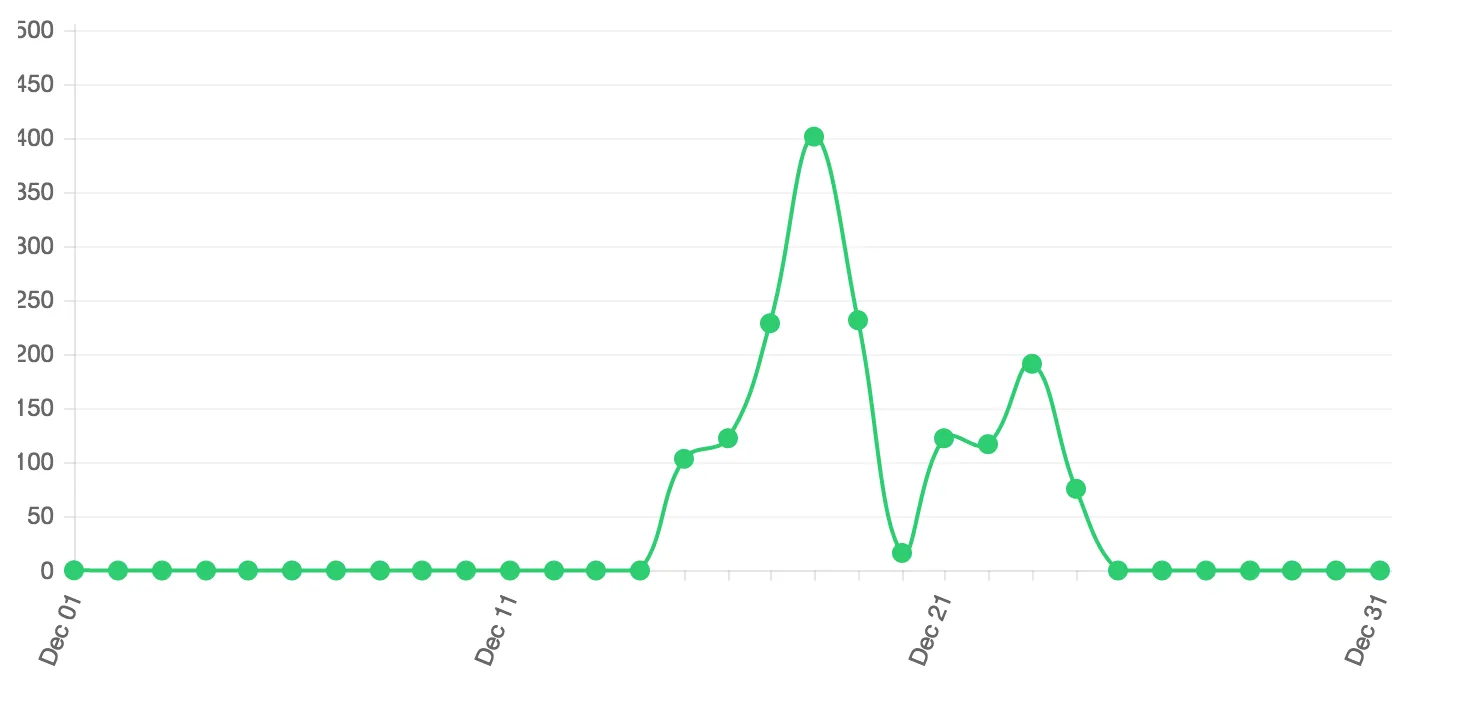
使用ChartJS 1.0.1绘制线图如上所示。如图所示,尽管有足够的空间,但x轴标签不是水平的。我该如何使其水平呢?
附带一个问题,注意到y轴标签被剪裁了1-2像素。如何解决这个问题呢?
使用ChartJS 1.0.1绘制线图如上所示。如图所示,尽管有足够的空间,但x轴标签不是水平的。我该如何使其水平呢?
附带一个问题,注意到y轴标签被剪裁了1-2像素。如何解决这个问题呢?
var myChart = new Chart(ctx, {
  type: 'bar',
  data: chartData,
  options: {
    scales: {
      xAxes: [{
        ticks: {
          autoSkip: false,
          maxRotation: 0,
          minRotation: 0
        }
      }]
    }
  }
});
0度的示例
90度的示例
在 scales > x > ticks 中使用旋转(Rotation)
scales: {
   x: {
    ticks: {
      autoSkip: false,
      maxRotation: 90,
      minRotation: 90
    }
   }
}
let chart = new Chart('myChart', {

type: 'line',
    data: {
        labels: ['Red', 'Blue', 'Yellow', 'Green', 'Purple', 'Orange'],
        datasets: [{
            label: '# of Votes',
            data: [12, 19, 3, 5, 2, 3]
        }]
    },
    options: {
        scales: {
            x: {
                ticks: {
                  autoSkip: false,
                  maxRotation: 90,
                  minRotation: 90
                }
            }
        }
    }
});<script src="https://cdn.jsdelivr.net/npm/chart.js@3.6.2/dist/chart.min.js"></script>
<canvas id="myChart" width="400" height="400"></canvas>尝试修复 chart.js 中的 calculateXLabelRotation 函数。
calculateXLabelRotation : function(){
    ...
        //↓↓↓
        this.xLabelRotation = 0;
        //↑↑↑
        if (this.xLabelRotation > 0){
            this.endPoint -= Math.sin(toRadians(this.xLabelRotation))*originalLabelWidth + 3;
        }
    ...
},
这是我的选项配置
const options = {
    responsive: true,
    plugins: {
      legend: {
        position: 'top',
      },
      tooltip: {
        enabled: true
      },
    },
    scales: {
        xAxis: {
            ticks: {
                maxTicksLimit: 7,
                minRotation: 0,
                maxRotation: 0
            }
        }
    }
  };