geom_rect和alpha - 使用硬编码值是否有效?

77

同一标题,但问题完全被重新措辞。

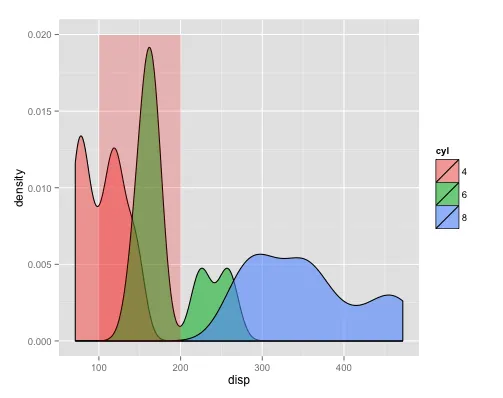
为什么alpha在第一个图中有效而在第二个图中无效?我很难理解为什么硬编码值时矩形绘制在正确位置但不透明,但在数据框中却按预期工作?

mtcars$cyl <- factor(mtcars$cyl)
mtcars$am <- factor(mtcars$am)

ggplot(mtcars) +
    geom_density(aes(x=disp, group=cyl, fill=cyl), alpha=0.6, adjust=0.75) + 
    geom_rect(data=data.frame(xmin=100, xmax=200, ymin=0, ymax=Inf), aes(xmin=xmin, xmax=xmax, ymin=ymin,ymax=ymax), fill="red", alpha=0.2) 

ggplot(mtcars) +
    geom_density(aes(x=disp, group=cyl, fill=cyl), alpha=0.6, adjust=0.75) + 
    geom_rect(aes(xmin=100, xmax=200, ymin=0,ymax=Inf), fill="red", alpha=0.2) 
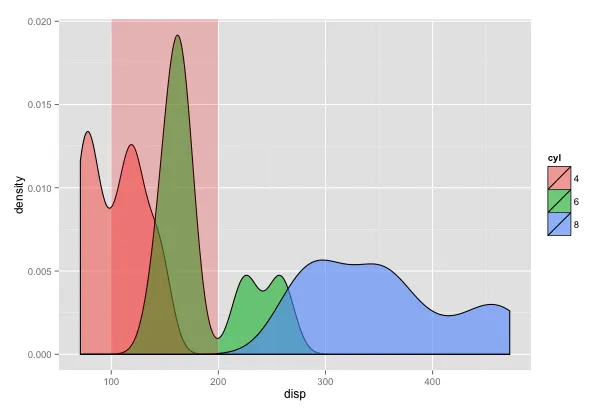
4个回答

161

对我来说这很令人困惑,所以我去了谷歌,并最终通过解决一些示例中的不确定性学到了新东西

显然,你正在在许多矩形上绘制,从而有效地使你想要的半透明度无效。因此,克服这个问题的唯一方法是在单独的 df 中硬编码矩形坐标,或者......

ggplot() + 
  geom_density(data=mtcars, aes(x=disp, group=cyl, fill=cyl), alpha=0.6, adjust=0.75) +
  geom_rect(aes(xmin=100, xmax=200, ymin=0,ymax=Inf), alpha=0.2, fill="red")

...只要不将你的数据框全局赋值给图形即可。相反,仅在您想要的图层(在此示例中为geom_density)中使用它,并使其他图层成为无数据框状态!或者,更好的方法是使用annotate从默认df外修改您的图形:

ggplot(mtcars) + 
  geom_density(aes(x=disp, group=cyl, fill=cyl), alpha=0.6, adjust=0.75) + 
  annotate("rect", xmin=100, xmax=200, ymin=0, ymax=Inf, alpha=0.2, fill="red") 

后一种方法可以让你在整个绘图过程中使用单个数据框,因此你不必为每层指定相同的df。

两种方法返回相同的图表:

enter image description here


3
仅作为补充,如果你与 scale_y_continuous 配合使用(比如设置 limits=c(0.005,0.015)),那么你需要确切地指定断点,也就是说,不能设置 (ymin=0, ymax=Inf),你的最小/最大值必须在比例尺范围内。 - nzcoops
5
太好了!但我仍然不明白为什么 geom_rect(..., alpha=.1) 不起作用,而 annotate("rect", ... alpha=.1) 起作用。 - Stuart
4
@Stuart,geom_rect()调用不会产生所需的alpha值,因为正如@sc_evans所解释的那样,它会为数据框中的每一行创建一个图层。相比之下,annotate()是一个特殊的图层,不会映射到数据框,因此只会绘制一个矩形(请参阅annotate()的帮助文件)。 - Stefan Avey
1
“alpha=0.2” 对我不起作用……无论 alpha 是多少(在 0 到 1 之间),都没有透明度。为什么? - Hercules Apergis
1
我无法将ggplot()、geom_rect(aes())、geom_histogram(aes())和facet_wrap()的组合工作起来(它在facet_wrap之前是有效的,但当我到达facet_wrap时alpha失败了,或者facet_wrap不起作用,因为它无法访问数据框)。但是annotate解决了问题!(如果您发现如何使带有alpha的geom_rect与facet_wrap一起工作,请告诉我) - Patrick Coulombe

27

另一种解决方法是给geom_rect()一个单行数据对象,以确保仅绘制一个矩形:

ggplot(mtcars) +
  geom_density(aes(x=disp, group=cyl, fill=cyl), alpha=0.6, adjust=0.75) + 
  geom_rect(data=mtcars[1,], aes(xmin=100, xmax=200, ymin=0,ymax=Inf), fill="red", alpha=0.2)

enter image description here


3
ggplot(df, aes(xmin = x, xmax = x + 1, ymin = y, ymax = y + 2)) +
  geom_rect(alpha=.2) + 
  geom_rect(data=data.frame(xmin=3, xmax=6, ymin=3, ymax=5), 
            aes(xmin=xmin,xmax=xmax,ymin=ymin,ymax=ymax), 
            fill="green", alpha=.2)

创建一个新的数据框(即使使用数据,而不是硬编码)似乎更好。请注意,在使用alpha时无法使用“color”。 - igorjrr

2

对于试图在分面时指定geom_rect中的填充和透明度值的人来说,我发现我必须指定与每个分面相符合的数据框中的一行,以使矩形出现在该分面中。 对于一个三个分面的点图和两个矩形,要扩展到3个分面:

plotpnts = ggplot(SHDates, aes(x=Order, y=NewMean))
Fig2 = plotpnts + 

# Rectangles for time periods   
geom_rect(data=SHDates[1,], xmin=0,ymin=500,xmax=39,ymax=1100, fill="red",    alpha=0.4) +
geom_rect(data=SHDates[11,], xmin=0,ymin=500,xmax=39,ymax=1100, fill="red", alpha=0.4) +
geom_rect(data=SHDates[22,], xmin=0,ymin=500,xmax=39,ymax=1100, fill="red", alpha=0.4) +
geom_rect(data=SHDates[1,], xmin=0,ymin=1000,xmax=39,ymax=1400, fill="orange", alpha=0.4) + 
geom_rect(data=SHDates[11,], xmin=0,ymin=1000,xmax=39,ymax=1400, fill="orange", alpha=0.4) + 
geom_rect(data=SHDates[22,], xmin=0,ymin=1000,xmax=39,ymax=1400, fill="orange", alpha=0.4) + 

网页内容由stack overflow 提供, 点击上面的
可以查看英文原文,
原文链接