我有一个非常基础的ggplot:
library(ggplot)

ggplot(mpg, aes(x=displ, y=manufacturer)) +
  geom_point() +
  geom_rect(aes(xmin=1.8, xmax=3.0, ymin='audi', ymax='audi', fill='red'))
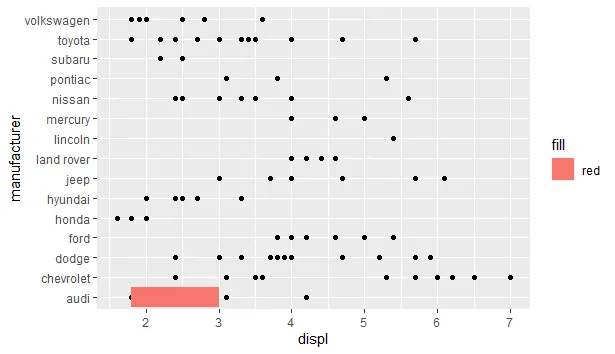
我想在y轴上的audi行上,从x轴值1.8到3.0之间添加一条条形图。在ggplot中是否有实现这一效果的方法?如果有任何其他帮助,请不吝赐教!
我有一个非常基础的ggplot:
library(ggplot)
ggplot(mpg, aes(x=displ, y=manufacturer)) +
geom_point() +
geom_rect(aes(xmin=1.8, xmax=3.0, ymin='audi', ymax='audi', fill='red'))
我想在y轴上的audi行上,从x轴值1.8到3.0之间添加一条条形图。在ggplot中是否有实现这一效果的方法?如果有任何其他帮助,请不吝赐教!
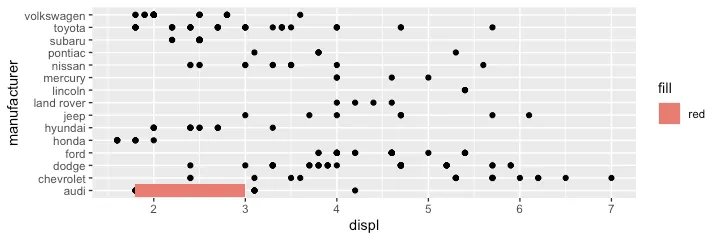
geom_rect 的 aes 调用中重新创建因子水平更加安全。这是因为被强制转换为整数的是因子的 水平 而不是字符字符串。ggplot(mpg, aes(x=displ, y=manufacturer)) +
geom_point() +
geom_rect(aes(ymin = which(levels(as.factor(manufacturer))=="audi") -0.5,
ymax = which(levels(as.factor(manufacturer))=="audi") +0.5,
xmin=1.8,
xmax=3,
fill="red"))
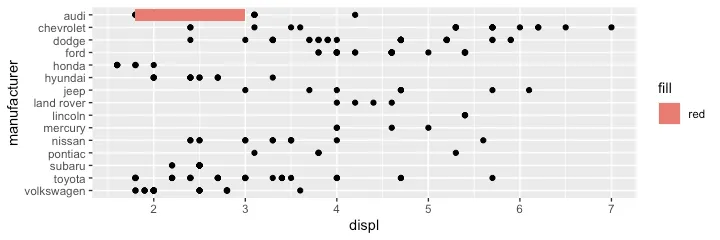
my.mpg <- mpg
my.mpg$manufacturer <-as.factor(my.mpg$manufacturer)
my.mpg$manufacturer <-factor(my.mpg$manufacturer,
                             levels = rev(levels(my.mpg$manufacturer)))
ggplot(my.mpg, aes(x=displ, y=manufacturer)) +
  geom_point() +
  geom_rect(aes(ymin = which(levels(as.factor(manufacturer))=="audi") -0.5,
                ymax = which(levels(as.factor(manufacturer))=="audi") +0.5,
                xmin=1.8,
                xmax=3,
                fill="red"))
which(unique(...)) 方法失败:man_list <- unique(my.mpg$manufacturer)
ggplot(my.mpg, aes(x=displ, y=manufacturer)) +
geom_point() +
# geom_rect(aes(xmin=1.8, xmax=3.0, ymin= "audi", ymax=lead("audi"), fill='red'))
geom_rect(aes(ymin = which(man_list=="audi")-0.5,
ymax = which(man_list=="audi")+0.5,
xmin=1.8,
xmax=3,
fill="red"))
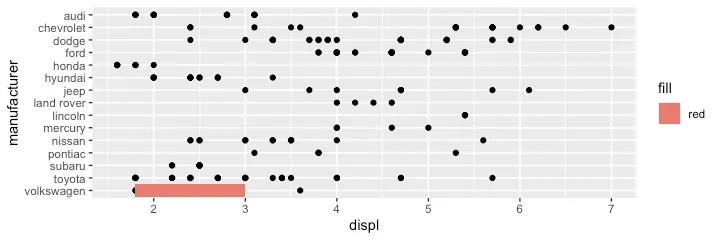
audi 是第一个类别,所以整数是 1),或者像我下面所做的那样,制作一个类别名称列表并进行指定。library(ggplot)
data("mpg")
man_list <- unique(mpg$manufacturer)
ggplot(mpg, aes(x=displ, y=manufacturer)) +
geom_point() +
# geom_rect(aes(xmin=1.8, xmax=3.0, ymin= "audi", ymax=lead("audi"), fill='red'))
geom_rect(aes(ymin = which(man_list=="audi")-0.5,
ymax = which(man_list=="audi")+0.5,
xmin=1.8,
xmax=3,
fill="red"))