我正在寻找一种在R中对大量数字进行局部最大值/最小值计算的高效算法。
希望不使用
for循环...
例如,如果我有一个数据文件如1 2 3 2 1 1 2 1,我希望该函数返回3和7,它们是局部最大值的位置。for循环...
例如,如果我有一个数据文件如1 2 3 2 1 1 2 1,我希望该函数返回3和7,它们是局部最大值的位置。diff(diff(x))(或者diff(x,differences=2):感谢@ZheyuanLi)本质上计算了二阶导数的离散模拟,因此在局部极大值处应该为负。下面的+1用于处理diff结果长度小于输入向量的情况。
编辑:添加了@Tommy关于delta-x不等于1的修正...
tt <- c(1,2,3,2,1, 1, 2, 1)
which(diff(sign(diff(tt)))==-2)+1
我的建议(http://statweb.stanford.edu/~tibs/PPC/Rdist/)适用于数据较嘈杂的情况。
@Ben的解决方案非常棒。不过它无法处理以下情况:
# all these return numeric(0):
x <- c(1,2,9,9,2,1,1,5,5,1) # duplicated points at maxima
which(diff(sign(diff(x)))==-2)+1
x <- c(2,2,9,9,2,1,1,5,5,1) # duplicated points at start
which(diff(sign(diff(x)))==-2)+1
x <- c(3,2,9,9,2,1,1,5,5,1) # start is maxima
which(diff(sign(diff(x)))==-2)+1
这里是一个更健壮(但更慢,更丑)的版本:
localMaxima <- function(x) {
  # Use -Inf instead if x is numeric (non-integer)
  y <- diff(c(-.Machine$integer.max, x)) > 0L
  rle(y)$lengths
  y <- cumsum(rle(y)$lengths)
  y <- y[seq.int(1L, length(y), 2L)]
  if (x[[1]] == x[[2]]) {
    y <- y[-1]
  }
  y
}

x <- c(1,2,9,9,2,1,1,5,5,1)
localMaxima(x) # 3, 8
x <- c(2,2,9,9,2,1,1,5,5,1)
localMaxima(x) # 3, 8
x <- c(3,2,9,9,2,1,1,5,5,1)
localMaxima(x) # 1, 3, 8
y <- diff(c(.Machine$integer.max, x)) < 0L(这保留了检测初始最小值的可能性)。 - ztllocalMaxima() 函数在拐点处产生误报,例如 localMaxima(c(1, 2, 2, 3, 2, 1)) 返回的结果是 2 4 而不是仅返回 4。需要进行改进。 - jacanterburyy <- cumsum(rle(y)$lengths),但不理解前面的独立的rle(y)$lengths。 - Andy使用zoo库的rollapply函数:
x <- c(1, 2, 3, 2, 1, 1, 2, 1)
library(zoo)
 xz <- as.zoo(x)
 rollapply(xz, 3, function(x) which.min(x)==2)
#    2     3     4     5     6     7
#FALSE FALSE FALSE  TRUE FALSE FALSE
 rollapply(xz, 3, function(x) which.max(x)==2)
#    2     3     4     5     6     7
#FALSE  TRUE FALSE FALSE FALSE  TRUE
使用“coredata”提取那些'which.max'是表示局部最大值的“中心值”的值的索引。您可以显然使用which.min而不是which.max来查找局部最小值。
 rxz <- rollapply(xz, 3, function(x) which.max(x)==2)
 index(rxz)[coredata(rxz)]
#[1] 3 7
我假设你不想要起始值或结束值,但如果你需要的话,你可以在处理之前填充向量的末尾,就像端粒在染色体上的作用一样。
(我注意到了ppc包(“Peak Probability Contrasts”)用于进行质谱分析,只是因为在阅读@BenBolker上面的评论之前,我不知道它的可用性,并且我认为增加这几个词将增加质谱学感兴趣的人通过搜索找到这个问题。)
align 参数。zoo:::rollapply.zoo 默认使用 align = "center",但 xts:::rollapply.xts 使用 align = "right"。 - mikeckxz上滚动一个宽度为3的窗口。这个窗口的内容是函数参数x,该函数返回最大值的索引。如果该索引指向窗口中心,则表示你已经找到了局部最大值!在这种特殊情况下,窗口宽度为3,因此中间元素的索引为2。基本上,你需要寻找一个条件which.max(x) == m,其中窗口宽度等于2*m-1。 - R Kiselevx <- c(3, 2, 2, 2, 2, 1, 3),然后 rx <- rollapply(as.zoo(x), 3, function(x) {which.min(x)==2}),而 index(rx)[coredata(rx)] 错误地给出了 [1] 2 6(正确应该是 [1] 6)。 - user3375672rxz <- rollapply(xz, 5, function(x) which.max(x)==2))添加数据到@jpmc26,例如x <- c(1, 2, 3, 2, 3, 4, 5, 6, 6, 5 ,4, 3, 2),早期的噪声干扰3,2,3被忽略,但高原6,6被正确检测。 - jacanterbury今天我试着做了一下这个。我知道你说尽量不要用for循环,但我坚持使用了apply函数。它相对紧凑快速,并允许阈值规定,所以你可以大于1。
inflect <- function(x, threshold = 1){
  up   <- sapply(1:threshold, function(n) c(x[-(seq(n))], rep(NA, n)))
  down <-  sapply(-1:-threshold, function(n) c(rep(NA,abs(n)), x[-seq(length(x), length(x) - abs(n) + 1)]))
  a    <- cbind(x,up,down)
  list(minima = which(apply(a, 1, min) == a[,1]), maxima = which(apply(a, 1, max) == a[,1]))
}
# Pick a desired threshold # to plot up to
n <- 2
# Generate Data
randomwalk <- 100 + cumsum(rnorm(50, 0.2, 1)) # climbs upwards most of the time
bottoms <- lapply(1:n, function(x) inflect(randomwalk, threshold = x)$minima)
tops <- lapply(1:n, function(x) inflect(randomwalk, threshold = x)$maxima)
# Color functions
cf.1 <- grDevices::colorRampPalette(c("pink","red"))
cf.2 <- grDevices::colorRampPalette(c("cyan","blue"))
plot(randomwalk, type = 'l', main = "Minima & Maxima\nVariable Thresholds")
for(i in 1:n){
  points(bottoms[[i]], randomwalk[bottoms[[i]]], pch = 16, col = cf.1(n)[i], cex = i/1.5)
}
for(i in 1:n){
  points(tops[[i]], randomwalk[tops[[i]]], pch = 16, col = cf.2(n)[i], cex = i/1.5)
}
legend("topleft", legend = c("Minima",1:n,"Maxima",1:n),
       pch = rep(c(NA, rep(16,n)), 2), col = c(1, cf.1(n),1, cf.2(n)),
       pt.cex =  c(rep(c(1, c(1:n) / 1.5), 2)), cex = .75, ncol = 2)
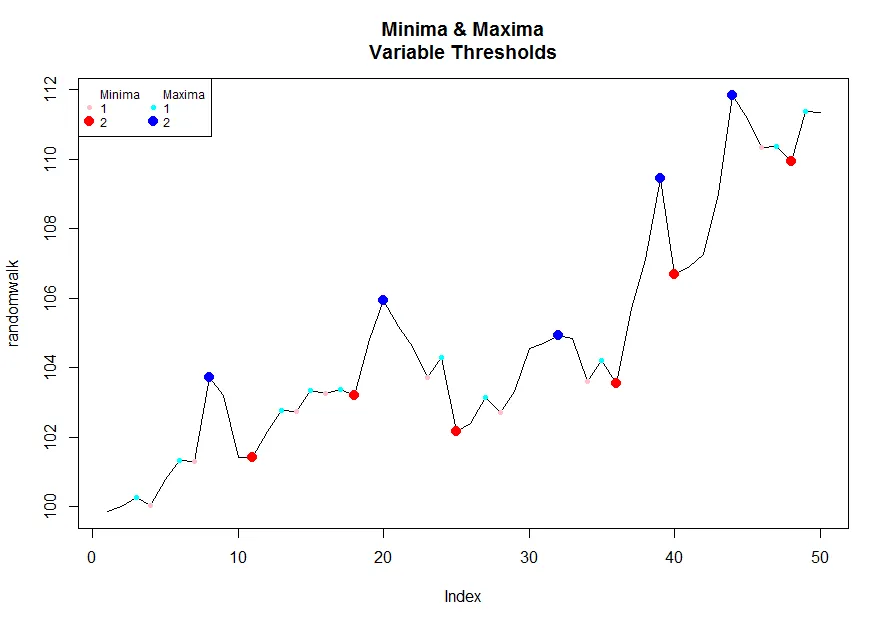
c(0,0,0,1,0.7,3,2,3,3,2,1,1,2,3,0.7, 0.5,0,0,0),阈值为3。 - Evan Friedland有一些不错的解决方案,但这取决于您的需求。
仅使用diff(tt)即可返回差异。
您希望检测何时从递增值转变为递减值。其中一种方法由@Ben提供:
diff(sign(diff(tt)))==-2
这里的问题是它只能检测到从严格增加到严格减少的变化。
稍作更改即可允许峰值处出现重复值(返回峰值最后一次出现的TRUE):
diff(diff(x)>=0)<0
如果您想检测开头或结尾的极大值,那么您只需要正确地填充前面和后面即可。
以下是包括寻找谷底在内的所有内容的函数:
 which.peaks <- function(x,partial=TRUE,decreasing=FALSE){
     if (decreasing){
         if (partial){
             which(diff(c(FALSE,diff(x)>0,TRUE))>0)
         }else {
             which(diff(diff(x)>0)>0)+1
         }
     }else {
         if (partial){
             which(diff(c(TRUE,diff(x)>=0,FALSE))<0)
         }else {
             which(diff(diff(x)>=0)<0)+1
         }
     }
 }
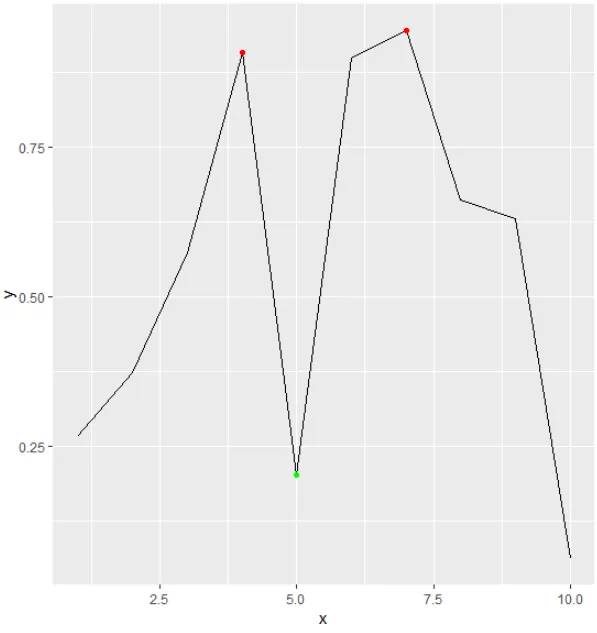
虽然有些晚,但这对其他人可能很有兴趣。现在你可以使用ggpmisc软件包中的(内部)函数find_peaks。您可以使用threshold、span和strict参数对其进行参数化。由于ggpmisc软件包旨在与ggplot2一起使用,因此您可以直接使用stat_peaks和stat_valleys函数绘制极小值和极大值:
set.seed(1)
x <- 1:10
y <- runif(10)
# Maxima
x[ggpmisc:::find_peaks(y)]
[1] 4 7
y[ggpmisc:::find_peaks(y)]
[1] 0.9082078 0.9446753
# Minima
x[ggpmisc:::find_peaks(-y)]
[1] 5
y[ggpmisc:::find_peaks(-y)]
[1] 0.2016819
# Plot
ggplot(data = data.frame(x, y), aes(x = x, y = y)) + geom_line() + stat_peaks(col = "red") + stat_valleys(col = "green")
ggplot2环境之外使用stat_peaks并没有太多意义。因为stat_peaks旨在在ggplot调用内使用。另一方面,我回答的第一部分在任何地方都适用。使用ggpmisc:::find_peaks计算极小值和极大值是通用的。 - undefined@42-的回答很好,但是我有一个使用案例,不想使用zoo。使用dplyr和lag、lead很容易实现:
library(dplyr)
test = data_frame(x = sample(1:10, 20, replace = TRUE))
mutate(test, local.minima = if_else(lag(x) > x & lead(x) > x, TRUE, FALSE)
与 rollapply 解决方案类似,您可以通过 n 和 default 参数来控制窗口大小和边缘情况的 lag/lead 方法。
在我所处理的情况中,重复数据经常出现。因此,我已经实现了一个函数,允许查找第一个或最后一个极值(最小值或最大值):
locate_xtrem <- function (x, last = FALSE)
{
  # use rle to deal with duplicates
  x_rle <- rle(x)

  # force the first value to be identified as an extrema
  first_value <- x_rle$values[1] - x_rle$values[2]

  # differentiate the series, keep only the sign, and use 'rle' function to
  # locate increase or decrease concerning multiple successive values.
  # The result values is a series of (only) -1 and 1.
  #
  # ! NOTE: with this method, last value will be considered as an extrema
  diff_sign_rle <- c(first_value, diff(x_rle$values)) %>% sign() %>% rle()

  # this vector will be used to get the initial positions
  diff_idx <- cumsum(diff_sign_rle$lengths)

  # find min and max
  diff_min <- diff_idx[diff_sign_rle$values < 0]
  diff_max <- diff_idx[diff_sign_rle$values > 0]

  # get the min and max indexes in the original series
  x_idx <- cumsum(x_rle$lengths)
  if (last) {
    min <- x_idx[diff_min]
    max <- x_idx[diff_max]
  } else {
    min <- x_idx[diff_min] - x_rle$lengths[diff_min] + 1
    max <- x_idx[diff_max] - x_rle$lengths[diff_max] + 1
  }
  # just get number of occurences
  min_nb <- x_rle$lengths[diff_min]
  max_nb <- x_rle$lengths[diff_max]

  # format the result as a tibble
  bind_rows(
    tibble(Idx = min, Values = x[min], NB = min_nb, Status = "min"),
    tibble(Idx = max, Values = x[max], NB = max_nb, Status = "max")) %>%
    arrange(.data$Idx) %>%
    mutate(Last = last) %>%
    mutate_at(vars(.data$Idx, .data$NB), as.integer)
}
对于原始问题的答案是:
> x <- c(1, 2, 3, 2, 1, 1, 2, 1)
> locate_xtrem(x)
# A tibble: 5 x 5
    Idx Values    NB Status Last
  <int>  <dbl> <int> <chr>  <lgl>
1     1      1     1 min    FALSE
2     3      3     1 max    FALSE
3     5      1     2 min    FALSE
4     7      2     1 max    FALSE
5     8      1     1 min    FALSE
> locate_xtrem(x, last = TRUE)
# A tibble: 5 x 5
    Idx Values    NB Status Last
  <int>  <dbl> <int> <chr>  <lgl>
1     1      1     1 min    TRUE
2     3      3     1 max    TRUE
3     6      1     2 min    TRUE
4     7      2     1 max    TRUE
5     8      1     1 min    TRUE
根据目标,可以在局部极值的第一个和最后一个值之间进行切换。使用last=TRUE得到的第二个结果也可以通过"Idx"和"NB"两列之间的运算得到...
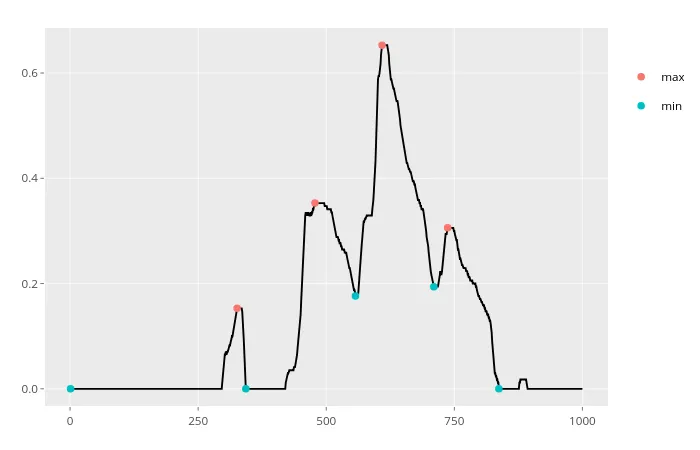
最后,为了处理数据中的噪声,可以实现一个函数来删除低于给定阈值的波动。由于这超出了初始问题的范围,因此不公开代码。我已将其封装在一个包中(主要是为了自动化测试过程),以下是一个结果示例:
x_series %>% xtrem::locate_xtrem()
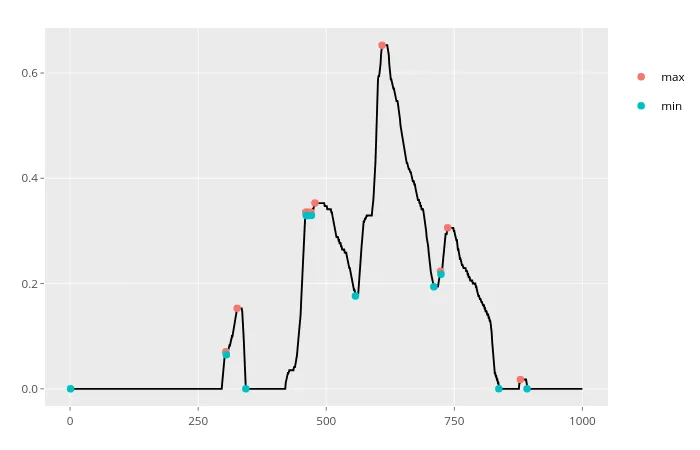
x_series %>% xtrem::locate_xtrem() %>% remove_noise()
之前的解决方案中,我在获取位置信息时遇到了一些问题,并想出了一种直接获取最小值和最大值的方法。以下代码将实现此功能,并绘制图表,在图表中用绿色标记最小值,用红色标记最大值。与which.max()函数不同的是,这将从数据框中提取所有最小值/最大值的索引。第一个diff()函数中添加零值是为了解决使用该函数时会导致结果长度减少的问题。将其插入到最内层的diff()函数调用中可以避免在逻辑表达式外部添加偏移量。虽然这并不重要,但我觉得这是一种更清晰的方法。
# create example data called stockData
stockData = data.frame(x = 1:30, y=rnorm(30,7))

# get the location of the minima/maxima. note the added zero offsets
# the location to get the correct indices
min_indexes = which(diff(  sign(diff( c(0,stockData$y)))) == 2)
max_indexes = which(diff(  sign(diff( c(0,stockData$y)))) == -2)

# get the actual values where the minima/maxima are located
min_locs = stockData[min_indexes,]
max_locs = stockData[max_indexes,]

# plot the data and mark minima with red and maxima with green
plot(stockData$y, type="l")
points( min_locs, col="red", pch=19, cex=1  )
points( max_locs, col="green", pch=19, cex=1  )
max_indexes = sign(diff( c(0,histData$counts,0)))) 这个代码虽然能正常工作,但我不知道它是否会影响其他部分。 - idontgetoutmuchx <- c(1,2,3,2,1,2,1)
which(diff(sign(diff(x)))==+2)+1 # 5
localMinima <- function(x) {
  # Use -Inf instead if x is numeric (non-integer)
  y <- diff(c(.Machine$integer.max, x)) > 0L
  rle(y)$lengths
  y <- cumsum(rle(y)$lengths)
  y <- y[seq.int(1L, length(y), 2L)]
  if (x[[1]] == x[[2]]) {
    y <- y[-1]
  }
  y
}

x <- c(1,2,9,9,2,1,1,5,5,1)
localMinima(x) # 1, 7, 10
x <- c(2,2,9,9,2,1,1,5,5,1)
localMinima(x) # 7, 10
x <- c(3,2,9,9,2,1,1,5,5,1)
localMinima(x) # 2, 7, 10
localMaxima还是localMinima,都无法处理起始位置的重复最大值/最小值!
which(diff(sign(diff(x)))==-2)+1。 - Tommyabs()适当地,如果你想要同时寻找两者),你应该将==-2更改为==2。 - Ben Bolker