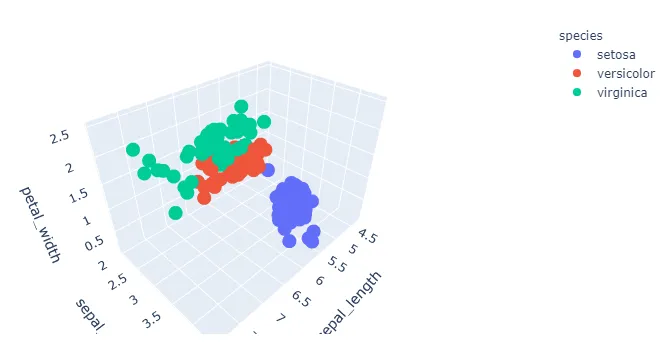
我可能理解有误,但是我认为你实际上是在询问 plotly.express 的一个广泛使用的内置功能,其中可以为标记数据的子组分配颜色。以 px.data.iris 数据集为例:
fig = px.scatter_3d(df, x='sepal_length', y='sepal_width', z='petal_width',
              color='species')
在这里,颜色被分配给不同的物种,其中你有三个独特的值['setosa', 'versicolor', 'virginica']:
   sepal_length  sepal_width  petal_length  petal_width species  species_id
0           5.1          3.5           1.4          0.2  setosa           1
1           4.9          3.0           1.4          0.2  setosa           1
2           4.7          3.2           1.3          0.2  setosa           1
3           4.6          3.1           1.5          0.2  setosa           1
4           5.0          3.6           1.4          0.2  setosa           1
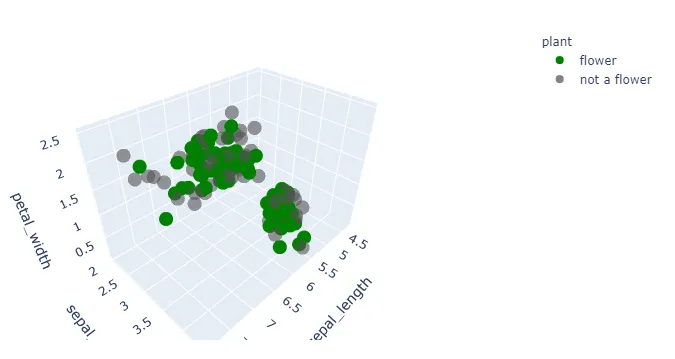
这个例子可以通过像上面那样更改颜色方案来扩展,此时您的颜色方案可以由一个字典定义:
colors = {"flower": 'green', 'not a flower': 'rgba(50,50,50,0.6)'}
或者你可以使用以下方式指定离散的颜色序列:
color_discrete_sequence = plotly.colors.sequential.Viridis
你也可以像这样添加一个新的列:
random.choice(['花', '不是花']),以更改你想要与颜色相关联的类别。
Plotly.graph_objects
如果你想使用
go.Scatter3d,那么我会为每个独特的子组建立一个迹线,并使用
itertools.cycle设置颜色,像这样:
colors = cycle(plotly.colors.sequential.Viridis)

fig = go.Figure()
for s in dfi.species.unique():
    df = dfi[dfi.species == s]
    fig.add_trace(go.Scatter3d(x=df['sepal_length'], y = df['sepal_width'], z = df['petal_width'],
                               mode = 'markers',
                               name = s,
                               marker_color = next(colors)))
Plotly Express的完整代码
import plotly.express as px
import random
df = px.data.iris()
colors = {"flower": 'green', 'not a flower': 'rgba(50,50,50,0.6)'}

df['plant'] = [random.choice(['flower', 'not a flower']) for obs in range(0, len(df))]
fig = px.scatter_3d(df, x='sepal_length', y='sepal_width', z='petal_width',
                color = 'plant',
                color_discrete_map=colors
                   )
fig.show()
Plotly图形对象的完整代码
import plotly.graph_objects as go
import plotly
from itertools import cycle

dfi = px.data.iris()
colors = cycle(plotly.colors.sequential.Viridis)

fig = go.Figure()
for s in dfi.species.unique():
    df = dfi[dfi.species == s]
    fig.add_trace(go.Scatter3d(x=df['sepal_length'], y = df['sepal_width'], z = df['petal_width'],
                               mode = 'markers',
                               name = s,
                               marker_color = next(colors)))
fig.show()