问题是basemap/matplotlib绘制给定文本时总是在左下角...我尝试了很多方法但都不起作用:
# Set up plot
fig, ax = plt.subplots(figsize=(15,15))
m1 = Basemap(projection='merc',
llcrnrlat=8.3,
urcrnrlat=53.9,
llcrnrlon=94.0,
urcrnrlon=147.6,
lat_ts=0,
resolution='c')
m1.fillcontinents(color='#191919',lake_color='#000000') # dark grey land, black lakes
m1.drawmapboundary(fill_color='#000000') # black background
m1.drawcountries(linewidth=0.1, color="w") # thin white line for country borders
m1.drawstates(linewidth=0.1, color="w")
# Plot the data
mxy = m1(new_results["Longitude"].tolist(), new_results["Latitude"].tolist())
m1.scatter(mxy[0], mxy[1], s=300,c=np.divide(new_results["SumVolume"],100000000), lw=0, alpha=1, zorder=5,cmap='Reds')
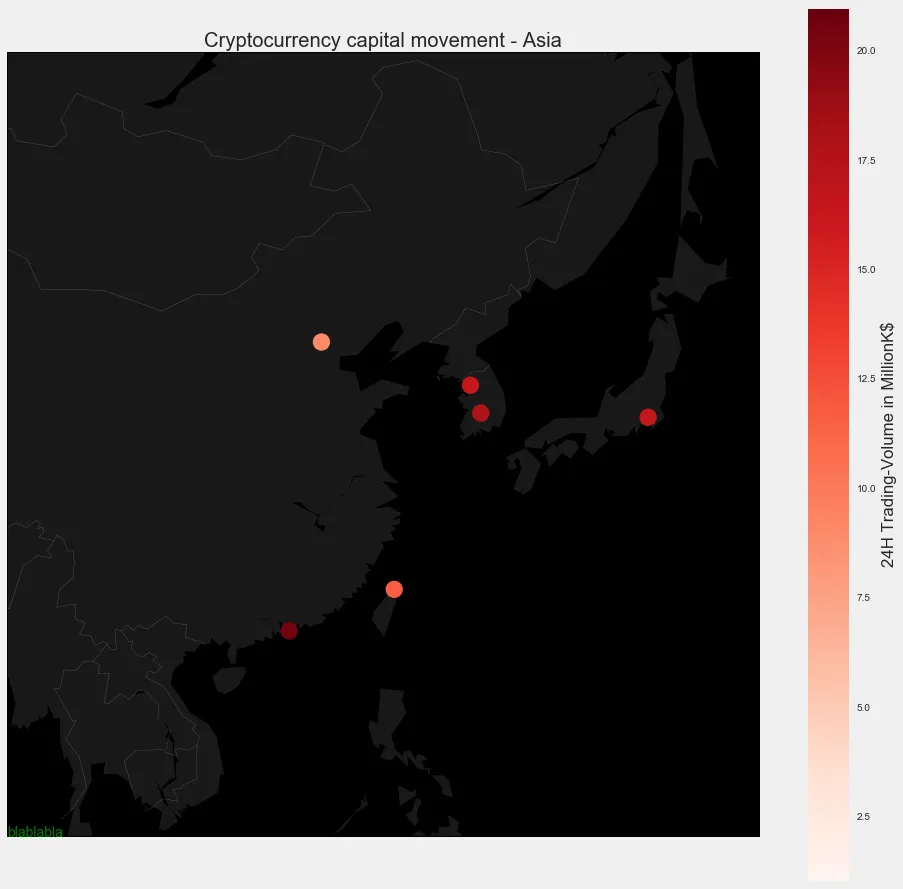
ax.annotate("blablabla", (121.597366,25.105497),color='green')
#colorbar
plt.colorbar(label=r'24H Trading-Volume in MillionK$')
plt.clim(1, 21)
plt.title("Cryptocurrency capital movement - Asia")
故事情节:
问题是什么?
ax.annotate("blablabla", (121.597366,25.105497),color='green')
我的需求是它不能如我所愿地工作。坐标(121.597366,25.105497)是地图上的一个点。顺便说一句,无论X,Y坐标是什么,它总是写在左下角。
ax.annotate("blablabla", m1(121.597366,25.105497),color='green')。 - swatchai