我正在尝试使用matplotlib和Basemap绘制地图上的点,其中这些点表示特定建筑物的纬度/经度。我的地图确实绘制了这些点,但将它们放在了错误的位置。当我使用相同的数据并使用Bokeh而不是matplotlib和basemap做同样的事情时,我得到了正确的绘图。
这是Bokeh中的正确结果: Bokeh Version
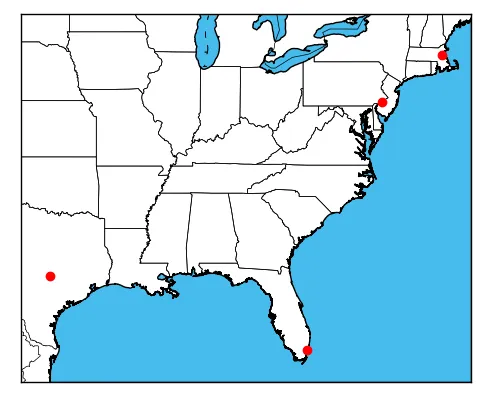
而这是Basemap中的不正确结果: Basemap Version
我在StackOverflow的其他讨论中看到有人提出,这可能与plot()“移动”经度有关。我尝试了那里的建议,即包括以下行: lons,lats = m.shiftdata(long,lat) 然后使用转换后的数据。但这没有任何可见影响。
我生成Basemap和Bokeh中两个图形的完整示例代码在此处:
import matplotlib.pyplot as plt
from mpl_toolkits.basemap import Basemap
import pandas as pd

from bokeh.plotting import figure, show
from bokeh.sampledata.us_states import data as states
from bokeh.models import ColumnDataSource, Range1d

# read in data to use for plotted points
buildingdf = pd.read_csv('buildingdata.csv')
lat = buildingdf['latitude'].values
long = buildingdf['longitude'].values

# determine range to print based on min, max lat and long of the data
margin = .2 # buffer to add to the range
lat_min = min(lat) - margin
lat_max = max(lat) + margin
long_min = min(long) - margin
long_max = max(long) + margin

# create map using BASEMAP
m = Basemap(llcrnrlon=long_min,
            llcrnrlat=lat_min,
            urcrnrlon=long_max,
            urcrnrlat=lat_max,
            lat_0=(lat_max - lat_min)/2,
            lon_0=(long_max-long_min)/2,
            projection='merc',
            resolution = 'h',
            area_thresh=10000.,
            )
m.drawcoastlines()
m.drawcountries()
m.drawstates()
m.drawmapboundary(fill_color='#46bcec')
m.fillcontinents(color = 'white',lake_color='#46bcec')
# convert lat and long to map projection coordinates
lons, lats = m(long, lat)
# plot points as red dots
m.scatter(lons, lats, marker = 'o', color='r')
plt.show()


# create map using Bokeh
source = ColumnDataSource(data = dict(lat = lat,lon = long))
# get state boundaries
state_lats = [states[code]["lats"] for code in states]
state_longs = [states[code]["lons"] for code in states]

p = figure(
           toolbar_location="left",
           plot_width=1100,
           plot_height=700,
           )

# limit the view to the min and max of the building data
p.y_range = Range1d(lat_min, lat_max)
p.x_range = Range1d(long_min, long_max)
p.xaxis.visible = False
p.yaxis.visible = False
p.xgrid.grid_line_color = None
p.ygrid.grid_line_color = None

p.patches(state_longs, state_lats, fill_alpha=0.0,
      line_color="black", line_width=2, line_alpha=0.3)

p.circle(x="lon", y="lat", source = source, size=4.5,
         fill_color='red',
         line_color='grey',
         line_alpha=.25
         )
show(p)
我没有足够的声望点来发布数据的链接或将其包含在此处。