在极坐标投影中添加色条到pcolormesh

7

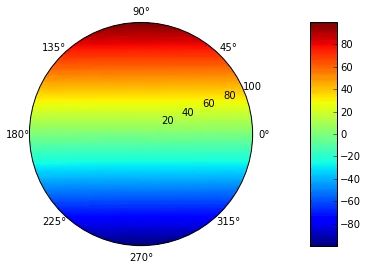
我正在尝试为具有极坐标投影的pcolormesh图添加色条。如果不指定极坐标投影,则代码可以正常工作。指定极坐标投影会导致绘制一个微小的图形,并且没有颜色条显示。我是在Fedora 20上使用matplotlib 1.3.1。这是我的问题还是bug?请帮忙检查一下。

import matplotlib.pyplot as plot
import mpl_toolkits.axes_grid1 as axes_grid1
import numpy as np

t = np.linspace(0.0, 2.0 * np.pi, 360)
r = np.linspace(0,100,200)
rg, tg = np.meshgrid(r,t)
c = rg * np.sin(tg)

# If I remove the projection="polar" argument here the 
ax = plot.subplot2grid((1, 1), (0, 0), projection="polar", aspect=1.)
im = ax.pcolormesh(t, r, c.T)
divider = axes_grid1.make_axes_locatable(ax)
cax = divider.append_axes("right", size="5%", pad=0.05)
plot.colorbar(im, cax=cax)
plot.show()
1个回答

6

你现在的做法实际上是在使用polar投影方式下的cax坐标轴。你可以通过以下方法进行验证:

cax = divider.append_axes("right", size="200%", pad=0.5)
#plot.colorbar(im, cax=cax)
cax.pcolormesh(t, r, c.T)

虽然这可能是一个错误,但我认为实现它更干净的方法是使用 GridSpec

gs = gridspec.GridSpec(1, 2,
                       width_ratios=[10,1],
                       )

ax1 = plt.subplot(gs[0], projection="polar", aspect=1.)
ax2 = plt.subplot(gs[1])

t = np.linspace(0.0, 2.0 * np.pi, 360)
r = np.linspace(0,100,200)
rg, tg = np.meshgrid(r,t)
c = rg * np.sin(tg)

im = ax1.pcolormesh(t, r, c.T)
plot.colorbar(im, cax=ax2)

enter image description here


非常感谢您的回复 - 我应该在我的问题中提到我已经通过Gridspec解决了这个问题 :) - JonathanU

网页内容由stack overflow 提供, 点击上面的
可以查看英文原文,
原文链接