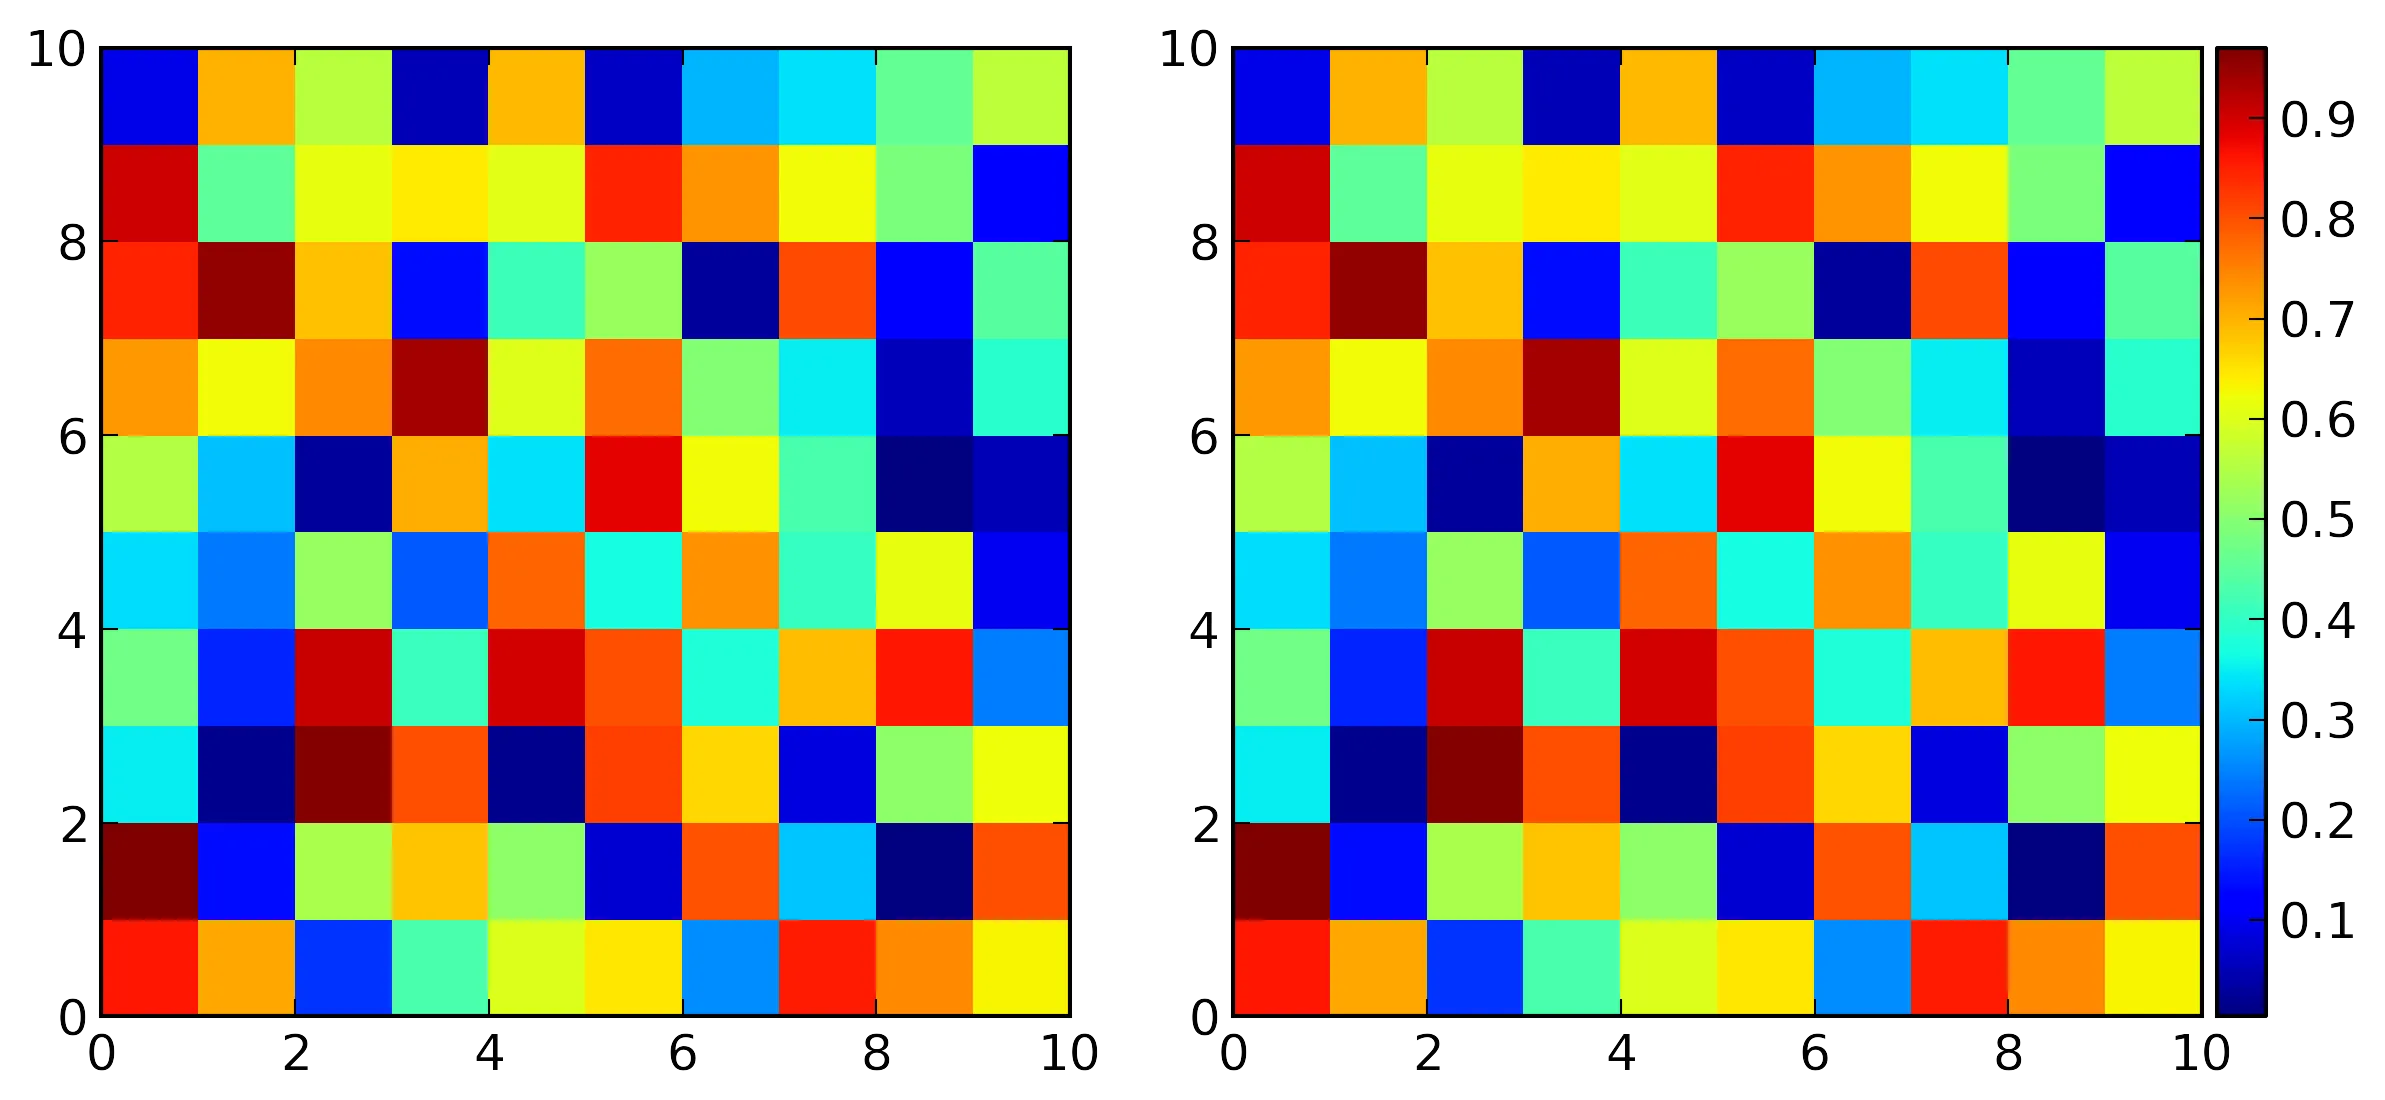
我试图为由两个具有相等纵横比的子图组成的绘图添加一个色条,即使用
使用下面显示的代码(以及笔记本中的这里)创建的图像是我能得到的最佳结果,但仍不完全符合我的要求。
set_aspect('equal'):
使用下面显示的代码(以及笔记本中的这里)创建的图像是我能得到的最佳结果,但仍不完全符合我的要求。
plt.subplot(1,2,1)
plt.pcolormesh(rand1)
plt.gca().set_aspect('equal')

plt.subplot(1,2,2)
plt.pcolormesh(rand2)
plt.gca().set_aspect('equal')

plt.tight_layout()

from mpl_toolkits.axes_grid1 import make_axes_locatable
divider = make_axes_locatable(plt.gca())
cax = divider.append_axes("right", size="5%", pad=0.05)

plt.colorbar(cax=cax)
这个问题似乎有关: