我有一个极坐标(r,theta)网格(每个单元格都是一个环形截面),其中包含某些物理量(例如温度)的值,我想将这些值重新网格化(或重新投影、重采样)到笛卡尔网格上。是否有任何可以完成这个任务的Python软件包?
我不想将单元格中心点的坐标从极坐标转换为笛卡尔坐标系 - 这很容易。相反,我正在寻找一个可以正确地重新网格化数据的软件包。
感谢任何建议!
import numpy as np

import matplotlib
matplotlib.use('Agg')
import matplotlib.pyplot as mpl

from scipy.interpolate import interp1d
from scipy.ndimage import map_coordinates


def polar2cartesian(r, t, grid, x, y, order=3):

    X, Y = np.meshgrid(x, y)

    new_r = np.sqrt(X*X+Y*Y)
    new_t = np.arctan2(X, Y)

    ir = interp1d(r, np.arange(len(r)), bounds_error=False)
    it = interp1d(t, np.arange(len(t)))

    new_ir = ir(new_r.ravel())
    new_it = it(new_t.ravel())

    new_ir[new_r.ravel() > r.max()] = len(r)-1
    new_ir[new_r.ravel() < r.min()] = 0

    return map_coordinates(grid, np.array([new_ir, new_it]),
                            order=order).reshape(new_r.shape)

# Define original polar grid

nr = 10
nt = 10

r = np.linspace(1, 100, nr)
t = np.linspace(0., np.pi, nt)
z = np.random.random((nr, nt))

# Define new cartesian grid

nx = 100
ny = 200

x = np.linspace(0., 100., nx)
y = np.linspace(-100., 100., ny)

# Interpolate polar grid to cartesian grid (nearest neighbor)

fig = mpl.figure()
ax = fig.add_subplot(111)
ax.imshow(polar2cartesian(r, t, z, x, y, order=0), interpolation='nearest')
fig.savefig('test1.png')

# Interpolate polar grid to cartesian grid (cubic spline)

fig = mpl.figure()
ax = fig.add_subplot(111)
ax.imshow(polar2cartesian(r, t, z, x, y, order=3), interpolation='nearest')
fig.savefig('test2.png')
这并不是严格的网格重构,但对我所需的工作很好。只是为了让其他人也能受益,我将代码发布在此。欢迎提出改进意见!
当我尝试将极坐标数据投影到笛卡尔网格中,或者反过来时,我在一段时间前找到了这篇文章。这里提出的解决方案很好用,但是进行坐标变换需要花费一些时间。我只是想分享另一种方法,可以将处理时间缩短至少 50 倍。
该算法使用了 scipy.ndimage.interpolation.map_coordinates 函数。
让我们看一个小例子:
import numpy as np

# Auxiliary function to map polar data to a cartesian plane
def polar_to_cart(polar_data, theta_step, range_step, x, y, order=3):

    from scipy.ndimage.interpolation import map_coordinates as mp

    # "x" and "y" are numpy arrays with the desired cartesian coordinates
    # we make a meshgrid with them
    X, Y = np.meshgrid(x, y)

    # Now that we have the X and Y coordinates of each point in the output plane
    # we can calculate their corresponding theta and range
    Tc = np.degrees(np.arctan2(Y, X)).ravel()
    Rc = (np.sqrt(X**2 + Y**2)).ravel()

    # Negative angles are corrected
    Tc[Tc < 0] = 360 + Tc[Tc < 0]

    # Using the known theta and range steps, the coordinates are mapped to
    # those of the data grid
    Tc = Tc / theta_step
    Rc = Rc / range_step

    # An array of polar coordinates is created stacking the previous arrays
    coords = np.vstack((Ac, Sc))

    # To avoid holes in the 360º - 0º boundary, the last column of the data
    # copied in the begining
    polar_data = np.vstack((polar_data, polar_data[-1,:]))

    # The data is mapped to the new coordinates
    # Values outside range are substituted with nans
    cart_data = mp(polar_data, coords, order=order, mode='constant', cval=np.nan)

    # The data is reshaped and returned
    return(cart_data.reshape(len(y), len(x)).T)

polar_data = ... # Here a 2D array of data is assumed, with shape thetas x ranges

# We create the x and y axes of the output cartesian data
x = y = np.arange(-100000, 100000, 1000)

# We call the mapping function assuming 1 degree of theta step and 500 meters of
# range step. The default order of 3 is used.
cart_data = polar_to_cart(polar_data, 1, 500, x, y)
我希望这能对跟我一样的人有所帮助。
使用 warpPolar() 函数,OpenCV 3.4 现在可以很容易地实现这个功能。
调用非常简单:
import numpy as np
import cv2
from matplotlib import pyplot as plt

# Read in our image from disk
image = cv2.imread('washington_quarter.png',0)
plt.imshow(image),plt.show()
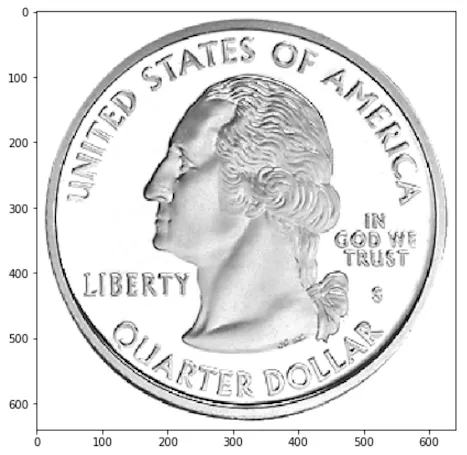
margin = 0.9 # Cut off the outer 10% of the image
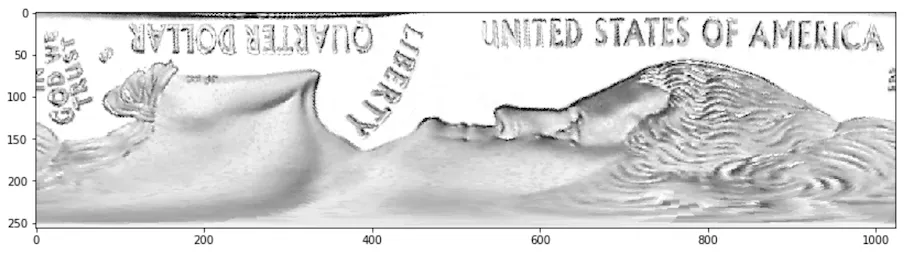
# Do the polar rotation along 1024 angular steps with a radius of 256 pixels.
polar_img = cv2.warpPolar(image, (256, 1024), (image.shape[0]/2,image.shape[1]/2), image.shape[1]*margin*0.5, cv2.WARP_POLAR_LINEAR)
# Rotate it sideways to be more visually pleasing
polar_img = cv2.rotate(polar_img, cv2.ROTATE_90_COUNTERCLOCKWISE)
plt.imshow(polar_img),plt.show()
scipy.ndimage.geometric_transform更紧凑地完成此操作。以下是一些示例代码:import numpy as N
import scipy as S
import scipy.ndimage
temperature = <whatever>
# This is the data in your polar grid.
# The 0th and 1st axes correspond to r and θ, respectively.
# For the sake of simplicity, θ goes from 0 to 2π,
# and r's units are just its indices.
def polar2cartesian(outcoords, inputshape, origin):
"""Coordinate transform for converting a polar array to Cartesian coordinates.
inputshape is a tuple containing the shape of the polar array. origin is a
tuple containing the x and y indices of where the origin should be in the
output array."""
xindex, yindex = outcoords
x0, y0 = origin
x = xindex - x0
y = yindex - y0
r = N.sqrt(x**2 + y**2)
theta = N.arctan2(y, x)
theta_index = N.round((theta + N.pi) * inputshape[1] / (2 * N.pi))
return (r,theta_index)
temperature_cartesian = S.ndimage.geometric_transform(temperature, polar2cartesian,
order=0,
output_shape = (temperature.shape[0] * 2, temperature.shape[0] * 2),
extra_keywords = {'inputshape':temperature.shape,
'center':(temperature.shape[0], temperature.shape[0])})
order=0以获得更好的插值效果。输出数组temperature_cartesian在此处为2r乘2r,但您可以指定任何大小和起点。abel.tools.polar.reproject_image_into_polar(),它是PyAbel包的一部分。scipy.ndimage.interpolation.map_coordinates是目前我们发现的从笛卡尔坐标系转换到极坐标系的最快方法。)pip install pyabel
然后,在Python中,您可以使用以下代码将图像重新投影到极坐标系:
import abel
abel.tools.polar.reproject_image_into_polar(MyImage)
[根据应用程序的不同,您可能考虑传递jacobian=True参数,该参数重新缩放矩阵的强度,以考虑从笛卡尔坐标变换为极坐标所导致的网格拉伸(更改“bin大小”)。
这里是一个完整的例子:
import numpy as np
import matplotlib.pyplot as plt
import abel
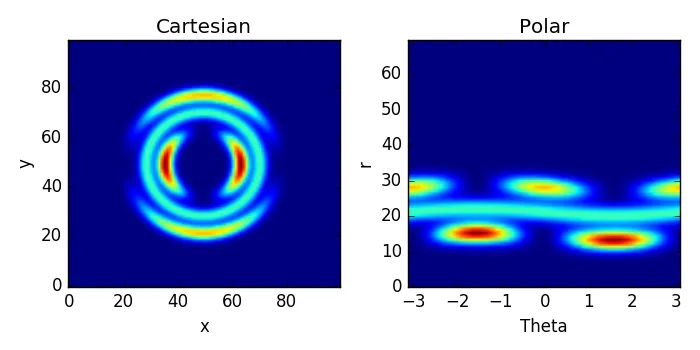
CartImage = abel.tools.analytical.sample_image(501)[201:-200, 201:-200]
PolarImage, r_grid, theta_grid = abel.tools.polar.reproject_image_into_polar(CartImage)
fig, axs = plt.subplots(1,2, figsize=(7,3.5))
axs[0].imshow(CartImage , aspect='auto', origin='lower')
axs[1].imshow(PolarImage, aspect='auto', origin='lower',
extent=(np.min(theta_grid), np.max(theta_grid), np.min(r_grid), np.max(r_grid)))
axs[0].set_title('Cartesian')
axs[0].set_xlabel('x')
axs[0].set_ylabel('y')
axs[1].set_title('Polar')
axs[1].set_xlabel('Theta')
axs[1].set_ylabel('r')
plt.tight_layout()
plt.show()
注意:关于将彩色图像重新映射到极坐标的讨论,还有一个很好的SO讨论:image information along a polar coordinate system
TypeError: 'numpy.float64' object cannot be interpreted as an integer错误。如果您是代码的维护者,应该检查一下。 - TomChoabel.tools.analytical.SampleImage(501).image[200:-200, 200:-200],然后将其插值到100x100网格(原来是101x101),然后进行变换。 - astroboylrxfrom scipy.interpolate import LinearNDInterpolator
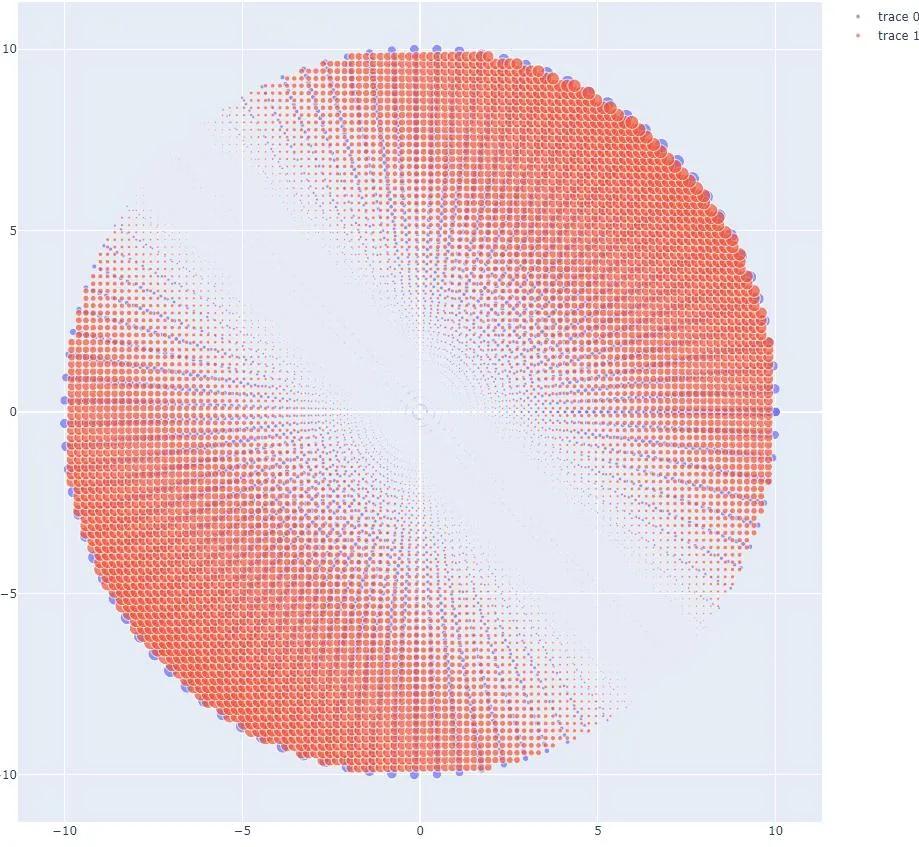
import numpy as np
import plotly.graph_objects as go
# List of thetas and rs for which your data is defined
t = np.linspace(0, 2*np.pi, 100)
r = np.linspace(0, 10, 50)
# Create a grid from those values
T, R = np.meshgrid(t, r)
# Convert to cartesian
xs = (R*np.cos(T)).flatten()
ys = (R*np.sin(T)).flatten()
# Define some arbitrary data at the (converted) x, y values
zs = np.abs(xs + ys)
# Define a new cartesian grid
X = np.linspace(-10, 10, 100)
Y = np.linspace(-10, 10, 100)
X, Y = np.meshgrid(X, Y)
# Create the interpolating function
interp = LinearNDInterpolator(list(zip(xs, ys)), zs)
Z = interp(X, Y)
# Get rid of nasty values
Z[np.isnan(Z)] = 0
# Plot the data
fig = go.Figure([
go.Scatter(x=xs, y=ys, mode='markers', marker=dict(size=zs)),
go.Scatter(x=X.flatten(), y=Y.flatten(), mode='markers', marker=dict(size=Z.flatten()))
]
)
fig.update_layout(showlegend=True, height=1000, width=1000)
fig.show()