这是我的数据:
data <- data.table(year = rep(1980:1985,each = 5),
                   Relationship = rep(c(" Acquaintance","Unknown","Wife","Stranger","Girlfriend","Friend"),  5),
                   N = sample(1:100, 30)
                   )
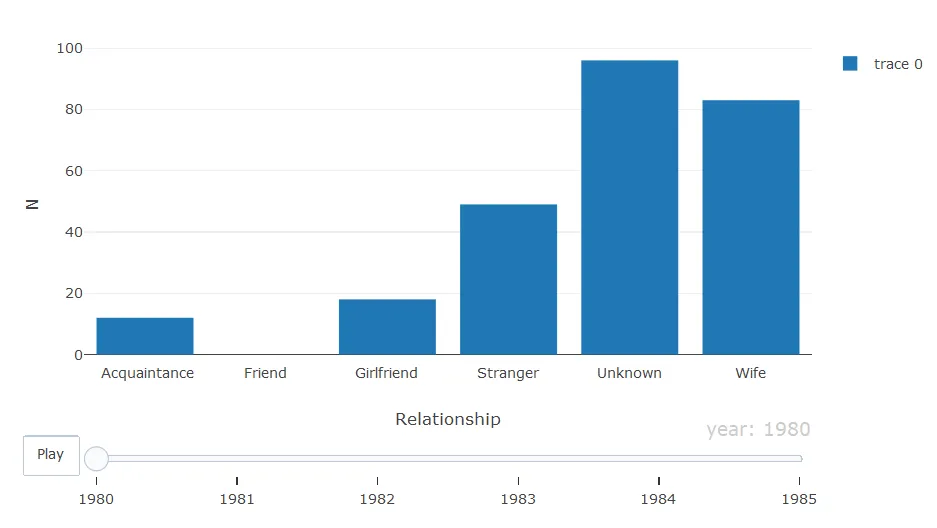
我可以使用plotly::plot_ly函数绘制一个动态地图,类似于以下的示例代码:
plot_ly(data
        ,x=~Relationship
        ,y=~N
        ,frame=~year
        ,type = 'bar'
)
使用参数frame时,我使用ggplot出现错误:Error in -data$group : invalid argument to unary operator
以下是我的ggplot代码:
p <- ggplot(data = data,aes(x =Relationship,y = N ))+
  geom_bar(stat = "identity",aes(frame = year))
ggplotly(p)
你能否修改我的ggplot代码以制作相同的图表?
该示例使用frame参数成功运行:
data(gapminder, package = "gapminder")
gg <- ggplot(gapminder, aes(gdpPercap, lifeExp, color = continent)) +
  geom_point(aes(size = pop, frame = year)) +
  scale_x_log10()
ggplotly(gg)
frame参数是用于 Plotly 的,而不是 ggplot2。 - Tao Hu