有没有办法像使用matplotlib一样使用plotly,让绘图出现在弹出窗口中?例如,是否有一个简单的等效方法:
plt.plot([1,2,3], [2, 3, 2.5])
plt.show()
我尝试了各种函数,但它们似乎要么创建一个html文件,要么创建一个图像文件。
plt.plot([1,2,3], [2, 3, 2.5])
plt.show()
我尝试了各种函数,但它们似乎要么创建一个html文件,要么创建一个图像文件。
您可以打开由Plotly创建的图像,以在默认的系统图像查看器中查看,该查看器是一种独立窗口。
import numpy as np
import plotly.graph_objs as go

fig = go.Figure()
fig.add_scatter(x=np.random.rand(100), y=np.random.rand(100), mode='markers',
                marker={'size': 30, 'color': np.random.rand(100), 'opacity': 0.6,
                        'colorscale': 'Viridis'});

def show(fig):
    import io
    import plotly.io as pio
    from PIL import Image
    buf = io.BytesIO()
    pio.write_image(fig, buf)
    img = Image.open(buf)
    img.show()

show(fig)
当然,这种方法的缺点是您不会有任何交互。
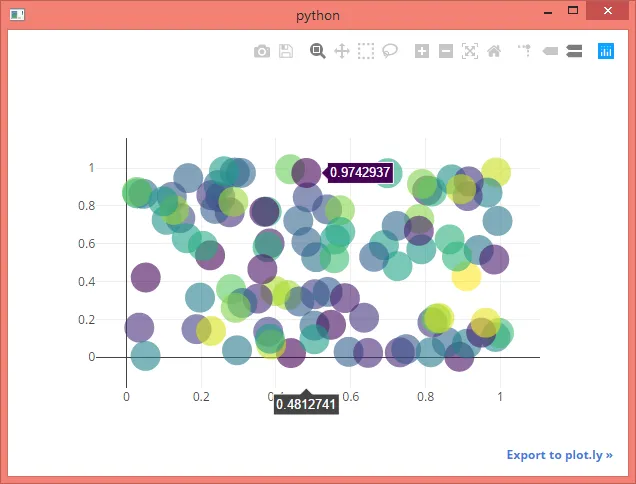
另一种方法是创建一个Web浏览器窗口,以显示由plotly生成的HTML页面。为此,您需要使用允许创建浏览器的GUI工具包之一,例如PyQt5。
因此,以下内容将创建一个带有浏览器的PyQt5窗口,并在其中加载由plotly创建的HTML页面,供您与之交互。(这已经在pyqt 5.9上进行了测试,可能无法与旧版本兼容。)
import numpy as np
import plotly.graph_objs as go


fig = go.Figure()
fig.add_scatter(x=np.random.rand(100), y=np.random.rand(100), mode='markers',
                marker={'size': 30, 'color': np.random.rand(100), 'opacity': 0.6,
                        'colorscale': 'Viridis'});


def show_in_window(fig):
    import sys, os
    import plotly.offline
    from PyQt5.QtCore import QUrl
    from PyQt5.QtWebEngineWidgets import QWebEngineView
    from PyQt5.QtWidgets import QApplication

    plotly.offline.plot(fig, filename='name.html', auto_open=False)

    app = QApplication(sys.argv)
    web = QWebEngineView()
    file_path = os.path.abspath(os.path.join(os.path.dirname(__file__), "name.html"))
    web.load(QUrl.fromLocalFile(file_path))
    web.show()
    sys.exit(app.exec_())


show_in_window(fig)
这应该很简单
import plotly.io as pio
pio.renderers.default = "browser"
fig.show(renderer="browser") 会打开一个新的选项卡,其中包含绘图。最大化或全屏显示将相应地缩放绘图。谢谢! - arielComatplotlib.__version__ = 3.4.3得到了一个TypeError: show() got an unexpected keyword argument 'renderer'的错误。你使用的是哪个版本? - nealmcb如果有人需要,这里是一个独立的类,基于ImportanceOfBeingErnest的答案制作而成。
import numpy as np
import plotly.graph_objs as go
import plotly.offline

fig = go.Figure()
fig.add_scatter(x=np.random.rand(100), y=np.random.rand(100), mode='markers',
                marker={'size': 30, 'color': np.random.rand(100), 'opacity': 0.6,
                        'colorscale': 'Viridis'});

import os, sys
from PyQt5.QtWidgets import QApplication
from PyQt5.QtCore import QUrl
from PyQt5 import QtWebEngineWidgets


class PlotlyViewer(QtWebEngineWidgets.QWebEngineView):
    def __init__(self, fig, exec=True):
        # Create a QApplication instance or use the existing one if it exists
        self.app = QApplication.instance() if QApplication.instance() else QApplication(sys.argv)

        super().__init__()

        self.file_path = os.path.abspath(os.path.join(os.path.dirname(__file__), "temp.html"))
        plotly.offline.plot(fig, filename=self.file_path, auto_open=False)
        self.load(QUrl.fromLocalFile(self.file_path))
        self.setWindowTitle("Plotly Viewer")
        self.show()

        if exec:
            self.app.exec_()

    def closeEvent(self, event):
        os.remove(self.file_path)


win = PlotlyViewer(fig)
__file__未定义,但是将os.path.dirname(__file__)替换为'.'可以解决问题。 - JLT