我想在我构建的频率直方图上叠加一个密度曲线。对于频率直方图,我使用了
这是我的数据。
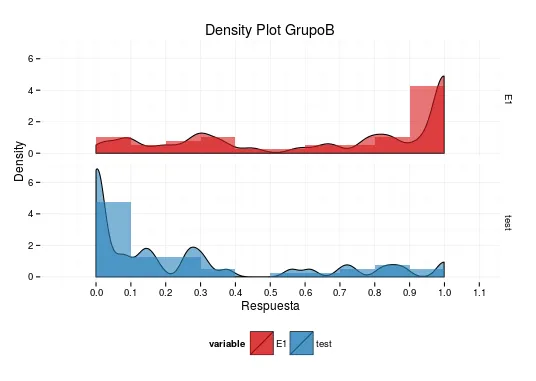
情节
我得到的输出是这个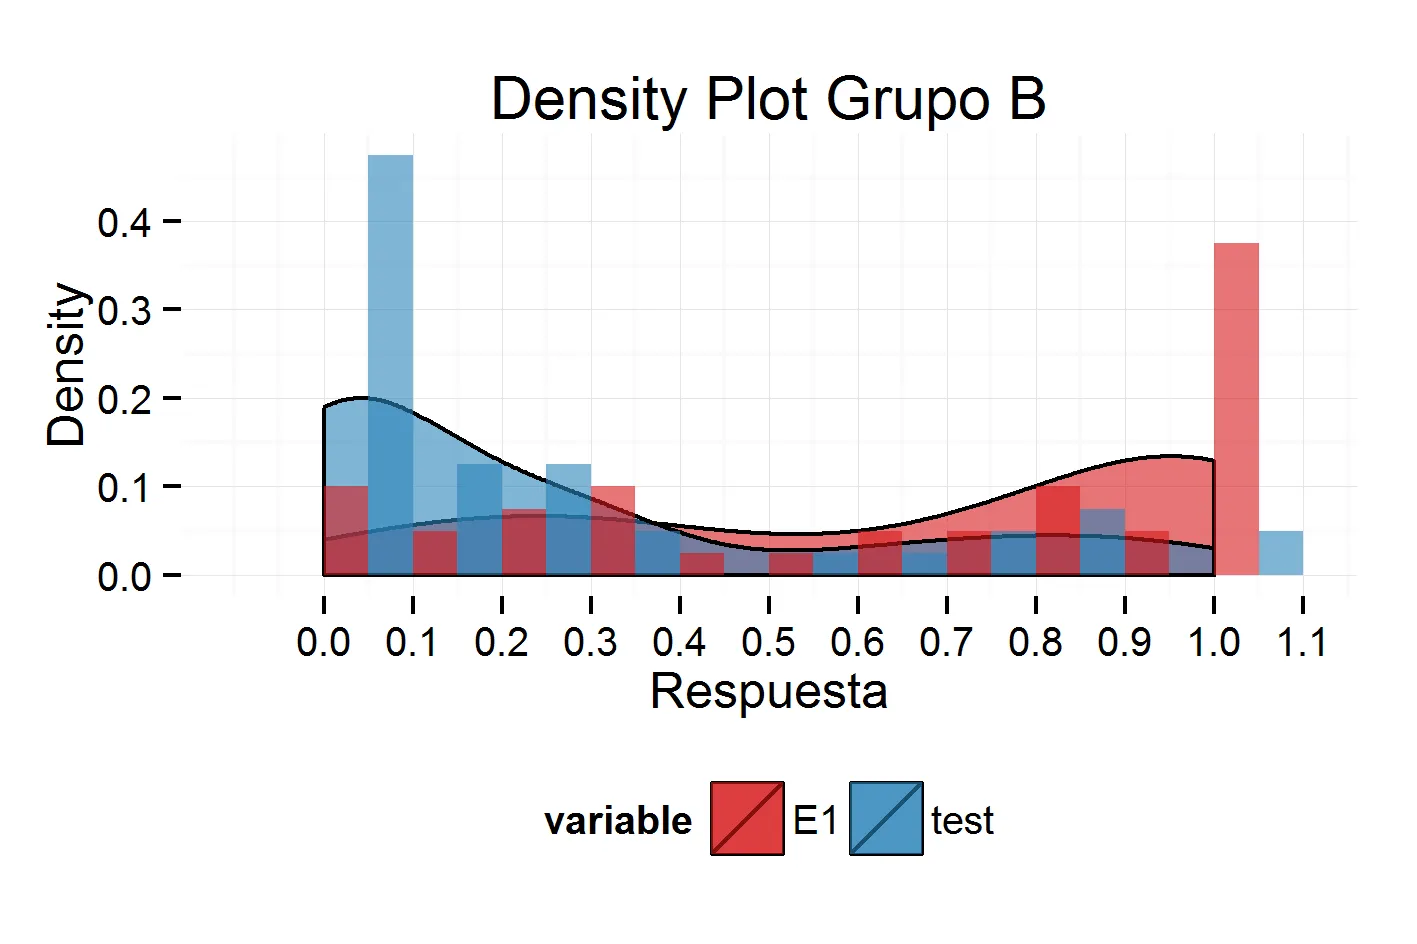
aes(y=..counts../40),因为40是我的样本总数。我使用了aes(y=..density..*0.1)来强制密度在0和1之间,因为我的binwidth为0.1。然而,密度曲线并不适合我的数据,并且它排除了等于1.0的值(请注意,直方图显示了bin=(1.0,1.1)的累积值,但是密度曲线在1.0处结束)。这是我的数据。
data<-structure(list(variable = structure(c(1L, 1L, 1L, 1L, 1L, 1L,
1L, 1L, 1L, 1L, 1L, 1L, 1L, 1L, 1L, 1L, 1L, 1L, 1L, 1L, 1L, 1L,
1L, 1L, 1L, 1L, 1L, 1L, 1L, 1L, 1L, 1L, 1L, 1L, 1L, 1L, 1L, 1L,
1L, 1L, 2L, 2L, 2L, 2L, 2L, 2L, 2L, 2L, 2L, 2L, 2L, 2L, 2L, 2L,
2L, 2L, 2L, 2L, 2L, 2L, 2L, 2L, 2L, 2L, 2L, 2L, 2L, 2L, 2L, 2L,
2L, 2L, 2L, 2L, 2L, 2L, 2L, 2L, 2L, 2L), .Label = c("E1", "test"
), class = "factor"), value = c(0.288888888888889, 0.0817901234567901,
0.219026548672566, 0.584795321637427, 0.927554980595084, 0.44661095636026,
1, 0.653780942692438, 1, 0.806451612903226, 1, 0.276794335371741,
1, 0.930109557990178, 0.776864728192162, 0.824909747292419, 1,
1, 1, 1, 1, 0.0875912408759124, 0.308065494238933, 1, 0.0258064516129032,
0.0167322834645669, 1, 1, 0.355605889014723, 0.310344827586207,
0.106598984771574, 0.364447494852436, 0.174724342663274, 0.77491961414791,
1, 0.856026785714286, 0.680759275237274, 0.850657108721625, 1,
1, 0, 0.851851851851852, 1, 0, 0.294954721862872, 0.819870009285051,
0, 0.734147168531706, 0.0135424091233072, 0.0189098998887653,
0.0101010101010101, 0, 0.296905222437137, 0.706837929731772,
0.269279393173198, 0.135379061371841, 0.158969804618117, 0.0902981940361193,
0.00423131170662906, 0, 0.374880611270296, 0.0425790754257908,
0.145542753183748, 0, 0.129032258064516, 0.260334645669291, 0,
0, 1, 0.175505350772889, 0.08248730964467, 0, 0.317217981340119,
0.614147909967846, 0, 0.264508928571429, 0.883520276100086, 0.0657108721624851,
0, 0.560229445506692)), row.names = c(NA, -80L), .Names = c("variable",
"value"), class = "data.frame")
情节
q<-ggplot(data, aes(value, fill = variable))
        q + geom_density(alpha = 0.6,aes(y=..density..*0.1),binwidth=0.1)
    + theme_minimal()+scale_fill_manual(values =c("#D7191C","#2B83BA"))
    + theme(legend.position="bottom")+ guides(fill=guide_legend(nrow=1))
    + labs(title="Density Plot GrupoB",x="Respuesta",y="Density")
    +scale_x_continuous(breaks=seq(from=0,to=1.2,by=0.1))
    +geom_histogram(alpha = 0.6,aes(y=..count../40),binwidth=0.1,position="dodge")
我得到的输出是这个