将tableGrob与ggplot2的y轴并列显示

5

有没有一种优雅的方法来将tableGrob行与轴断点对齐?

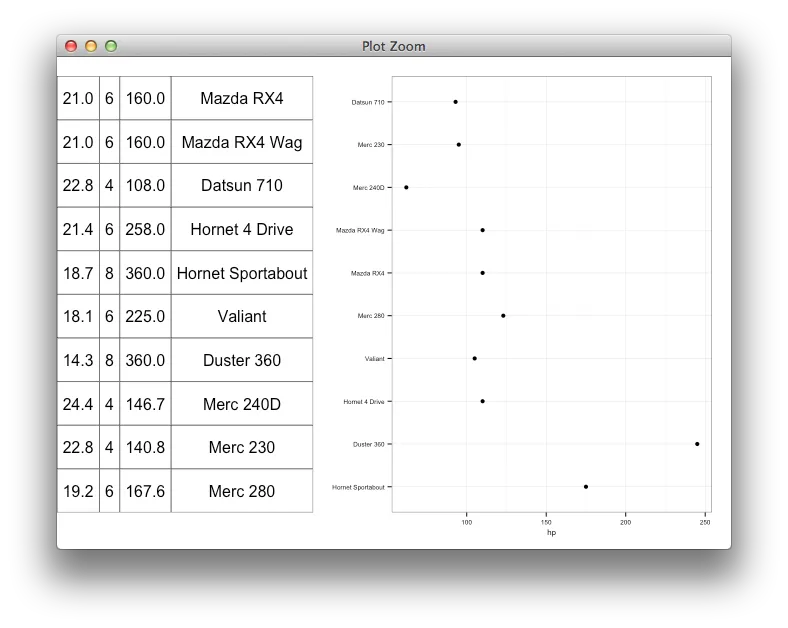
我想在R中并排放置一个tableGrob和ggplot图表(我需要复制以前版本公共报告中使用的一些SAS输出)。像这个最小可重现示例:

juxtaposed tableGrob and ggplot chart

这篇文章 帮了我很多——tableGrob与图表主体在同一gtable行中;但是,需要大量手动调整才能使tableGrob中的行与轴标签对齐。

我还发现了这篇文章。由于我正在编写公共报告,我希望不使用不容易在CRAN包中获得的代码。话虽如此,tableGrob的实验版本似乎接受高度作为参数。如果这段代码可以解决问题,并且我选择使用这个实验版本,那么我该如何计算适当的行高?

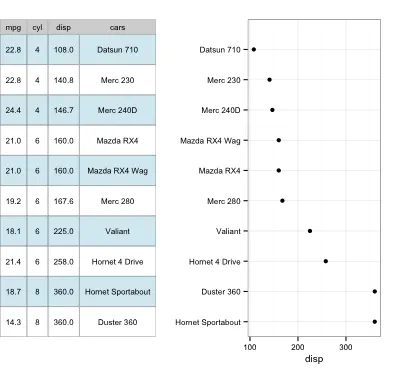
如果没有更优雅的方法,我发现以下技巧很有用:

  • 将tableGrob中的字体大小和cex设置为与ggplot2相匹配
  • 将padding.v设置为在tableGrob中间隔表格行
  • 修改坐标限制以适应列标签并与最后一行底部对齐

我的MRE代码:

library(ggplot2)
library(gridExtra)
library(gtable)

theme_set(theme_bw(base_size = 8))
df <- head(mtcars,10)
df$cars <- row.names(df)
df$cars <- factor(df$cars, levels=df$cars[order(df$disp, decreasing=TRUE)], ordered=TRUE)
p <- ggplot(data=df, aes(x=hp, y=cars)) +
  geom_point(aes(x=hp, y=cars)) +
  scale_y_discrete(limits=levels(df$cars))+
  theme(axis.title.y = element_blank()) +
  coord_cartesian(ylim=c(0.5,length(df$cars)+1.5))
t <- tableGrob(df[,c("mpg","cyl","disp","cars")],
               cols=c("mpg","cyl","disp","cars"),
               gpar.coretext = gpar(fontsize = 8, lineheight = 1, cex = 0.8),
               gpar.coltext = gpar(fontsize = 8, lineheight = 1, cex = 0.8),
               show.rownames = FALSE,
               show.colnames = TRUE,
               equal.height = TRUE,
               padding.v = unit(1.65, "mm"))
g <- NULL
g <- ggplotGrob(p)
g <- gtable_add_cols(g, unit(2,"in"), 0)
g <- gtable_add_grob(g, t, t=3, b=3, l=1, r=1)

png('./a.png', width = 5, height = 2, units = "in", res = 100)
grid.draw(g)
dev.off()

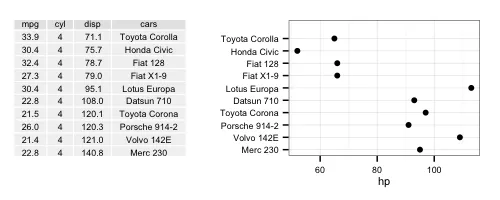
为了排除故障,我在y轴的间断处保留了汽车名称,但最终我会将它们删除。


1
计算行高:找出有多少行(n),并在gtable布局中对应于绘图面板的单元格中使用unit(1/n, "npc") - baptiste
@baptiste 谢谢。使用您的实验性软件包,我能够让某些东西工作起来。我有点粗糙,所以我会保留问题,等待比我更“适当”的答案。其他提示:ggplot2 :: theme()似乎与实验性tableGrob主题()冲突,但我真的不理解主题(或命名空间),所以YRMV;我需要更改主题字体;此外,exp。tableGrob似乎处理因素的顺序与gridExtra :: tableGrob不同;不确定是否实现了对齐;对于n =断点数,在y轴上无需填充坐标。 - penguinv22
2个回答

5
现在有这个实验版的,请参见此处

enter image description here

table <- gtable_table(df[,c("mpg","cyl","disp","cars")], 
                      heights = unit(rep(1,nrow(df)), "null"))

g <- ggplotGrob(p)
g <- gtable_add_cols(g, sum(table$widths), 0)
g <- gtable_add_grob(g, table, t=3, b=3, l=1, r=1)

grid.newpage()
grid.draw(g)

你如何添加列标题?我已经在github上的table.R文件中尝试了你的示例代码。使用colhead <- gtable_table(t(colnames(d))),我得到以下错误:Error in mmm < each : comparison of these types is not implemented - penguinv22
你不能使用原始的gtable文件,你需要安装我的分支包才能使其工作。 - baptiste
感谢澄清。我已经成功下载了你的分支并安装了它;但是,我注意到它目前需要R >= 3.2.0版本。这是有意为之吗?我想在我的源代码中包含使用devtools下载和安装软件包的说明;然而,如果不手动编辑R版本要求,它将无法安装。 - penguinv22
原因是网格最近的更改,如果我没记错,ggplot2将无法与我的gtable分支和旧版R一起使用。 - baptiste

2

@Baptiste的回答扩展了列标签和单元格参数的演示:

library(ggplot2)
library(gridExtra)
## I manually changed the dependency on 
install.packages(".//gtable_0.2.tar.gz", repos = NULL, type="source")

## The forked version of gtable requires R version 3.2.0 
## which is currently in development (as of 9/17/2014) due to change in grid 
## (https://github.com/wch/r-source/commit/850a82c30e91feb47a0b6385adcbd82988d90413)
## I have not installed the development version.
## However, I was able, in limited testing, to get this to work with R 3.1.0
## and ggplot2_1.0.0
## YRMV
## The following code, commented out, may be more useful with release of R 3.2.0
## library(devtools)
## devtools::install_github("baptiste/gtable")
library(gtable)

theme_set(theme_bw(base_size = 10))

df <- mtcars
df$cars <- row.names(df)
df <- head(df[,c("mpg","cyl","disp","cars")],10)
df$cars <- factor(df$cars, levels=df$cars[order(df$disp, decreasing=TRUE)], ordered=TRUE)

p <- ggplot(data=df, aes(x=disp, y=cars)) +
     geom_point(aes(x=disp, y=cars)) +
     scale_y_discrete(limits=levels(df$cars))+
     theme(axis.title.y = element_blank()) +
     coord_cartesian(ylim = c(0.5,nrow(df)+1))

core <- gtable_table(df[order(df$disp, decreasing=FALSE),],
                   fg.par = list(fontsize=c(8)),
                   bg.par = list(fill=c(rep("lightblue",4),rep("white",4)), alpha=0.5),
                   heights = unit(rep(1,nrow(df)), "null"))

colHead <- gtable_table(t(colnames(df)),
                    fg.par = list(fontsize=c(8)),
                    bg.par = list(fill=c(1), alpha=0.2),
                    heights = unit(0.5, "null"))
table1 <- rbind(colHead, core)

g <- ggplotGrob(p)
g <- gtable_add_cols(g, sum(table1$widths), 0)
g <- gtable_add_grob(g, table1, t=3, b=3, l=1, r=1)

grid.newpage()
grid.draw(g)

enter image description here


网页内容由stack overflow 提供, 点击上面的
可以查看英文原文,
原文链接