我有一个意大利的shapefile文件,正在将GIS数据绘制在上面。问题是,我有一辆公交车在城市(罗马)内运行的小轨迹,但是当我绘图时,它只显示为1个点。我猜测这是因为我的地图太小了。
如何缩放地图(.shp)?
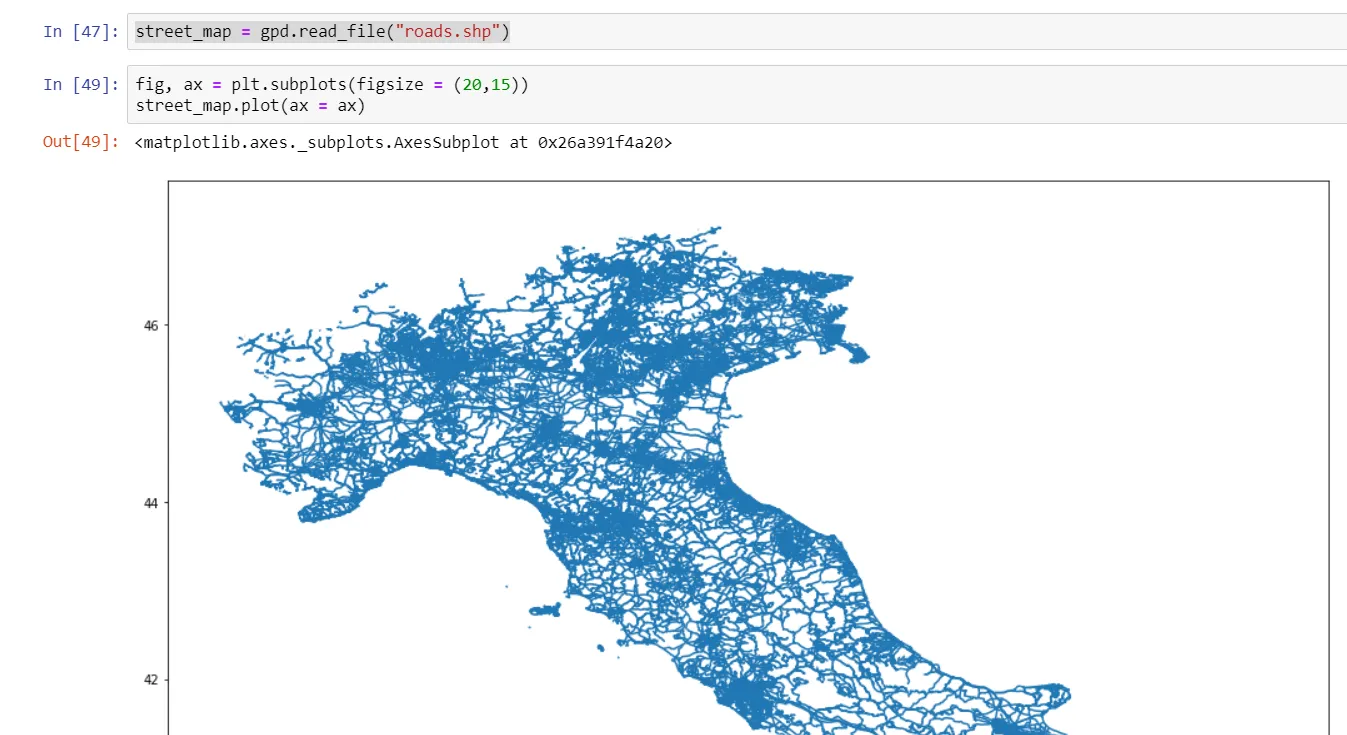
street_map = gpd.read_file("roads.shp")
...
...
fig,ax = plt.subplots(figsize = (20,15))
street_map.plot(ax = ax, alpha = 0.4, color = "grey")
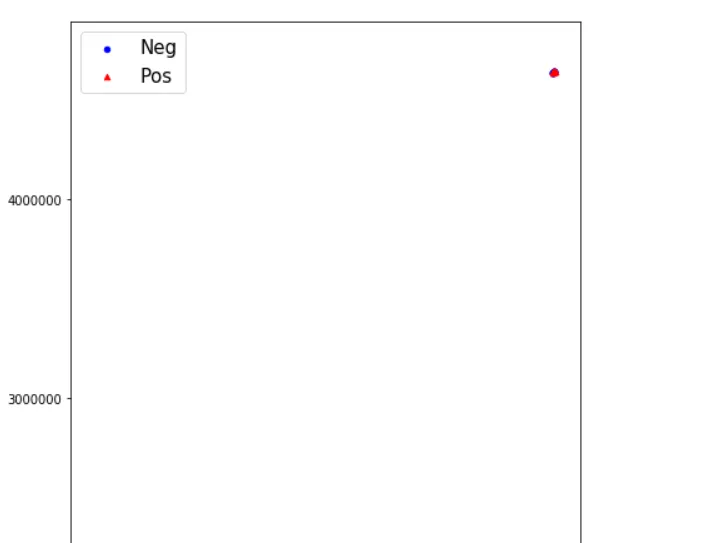
geo_df[geo_df['Perc_'] > 25].plot(ax = ax, markersize = 20, color = "blue",
marker = "o", label = "Neg")
geo_df[geo_df['Perc_'] < 25].plot(ax = ax, markersize = 20, color = "red",
marker = "^", label = "Pos")
plt.legend(prop={'size':15})