我想使用geopandas绘制一个shapefile。我希望线条的粗细与shapefile中的属性相符。我将使用以下命令:
shp_sub.plot(column='Case1_2', cmap='BuGn', figsize=(5,5), linewidth=shp_sub['Case1_2'], edgecolor='0.8', vmin=0, vmax=1)
这意味着厚度和颜色代码应该相匹配。
我尝试过这个:
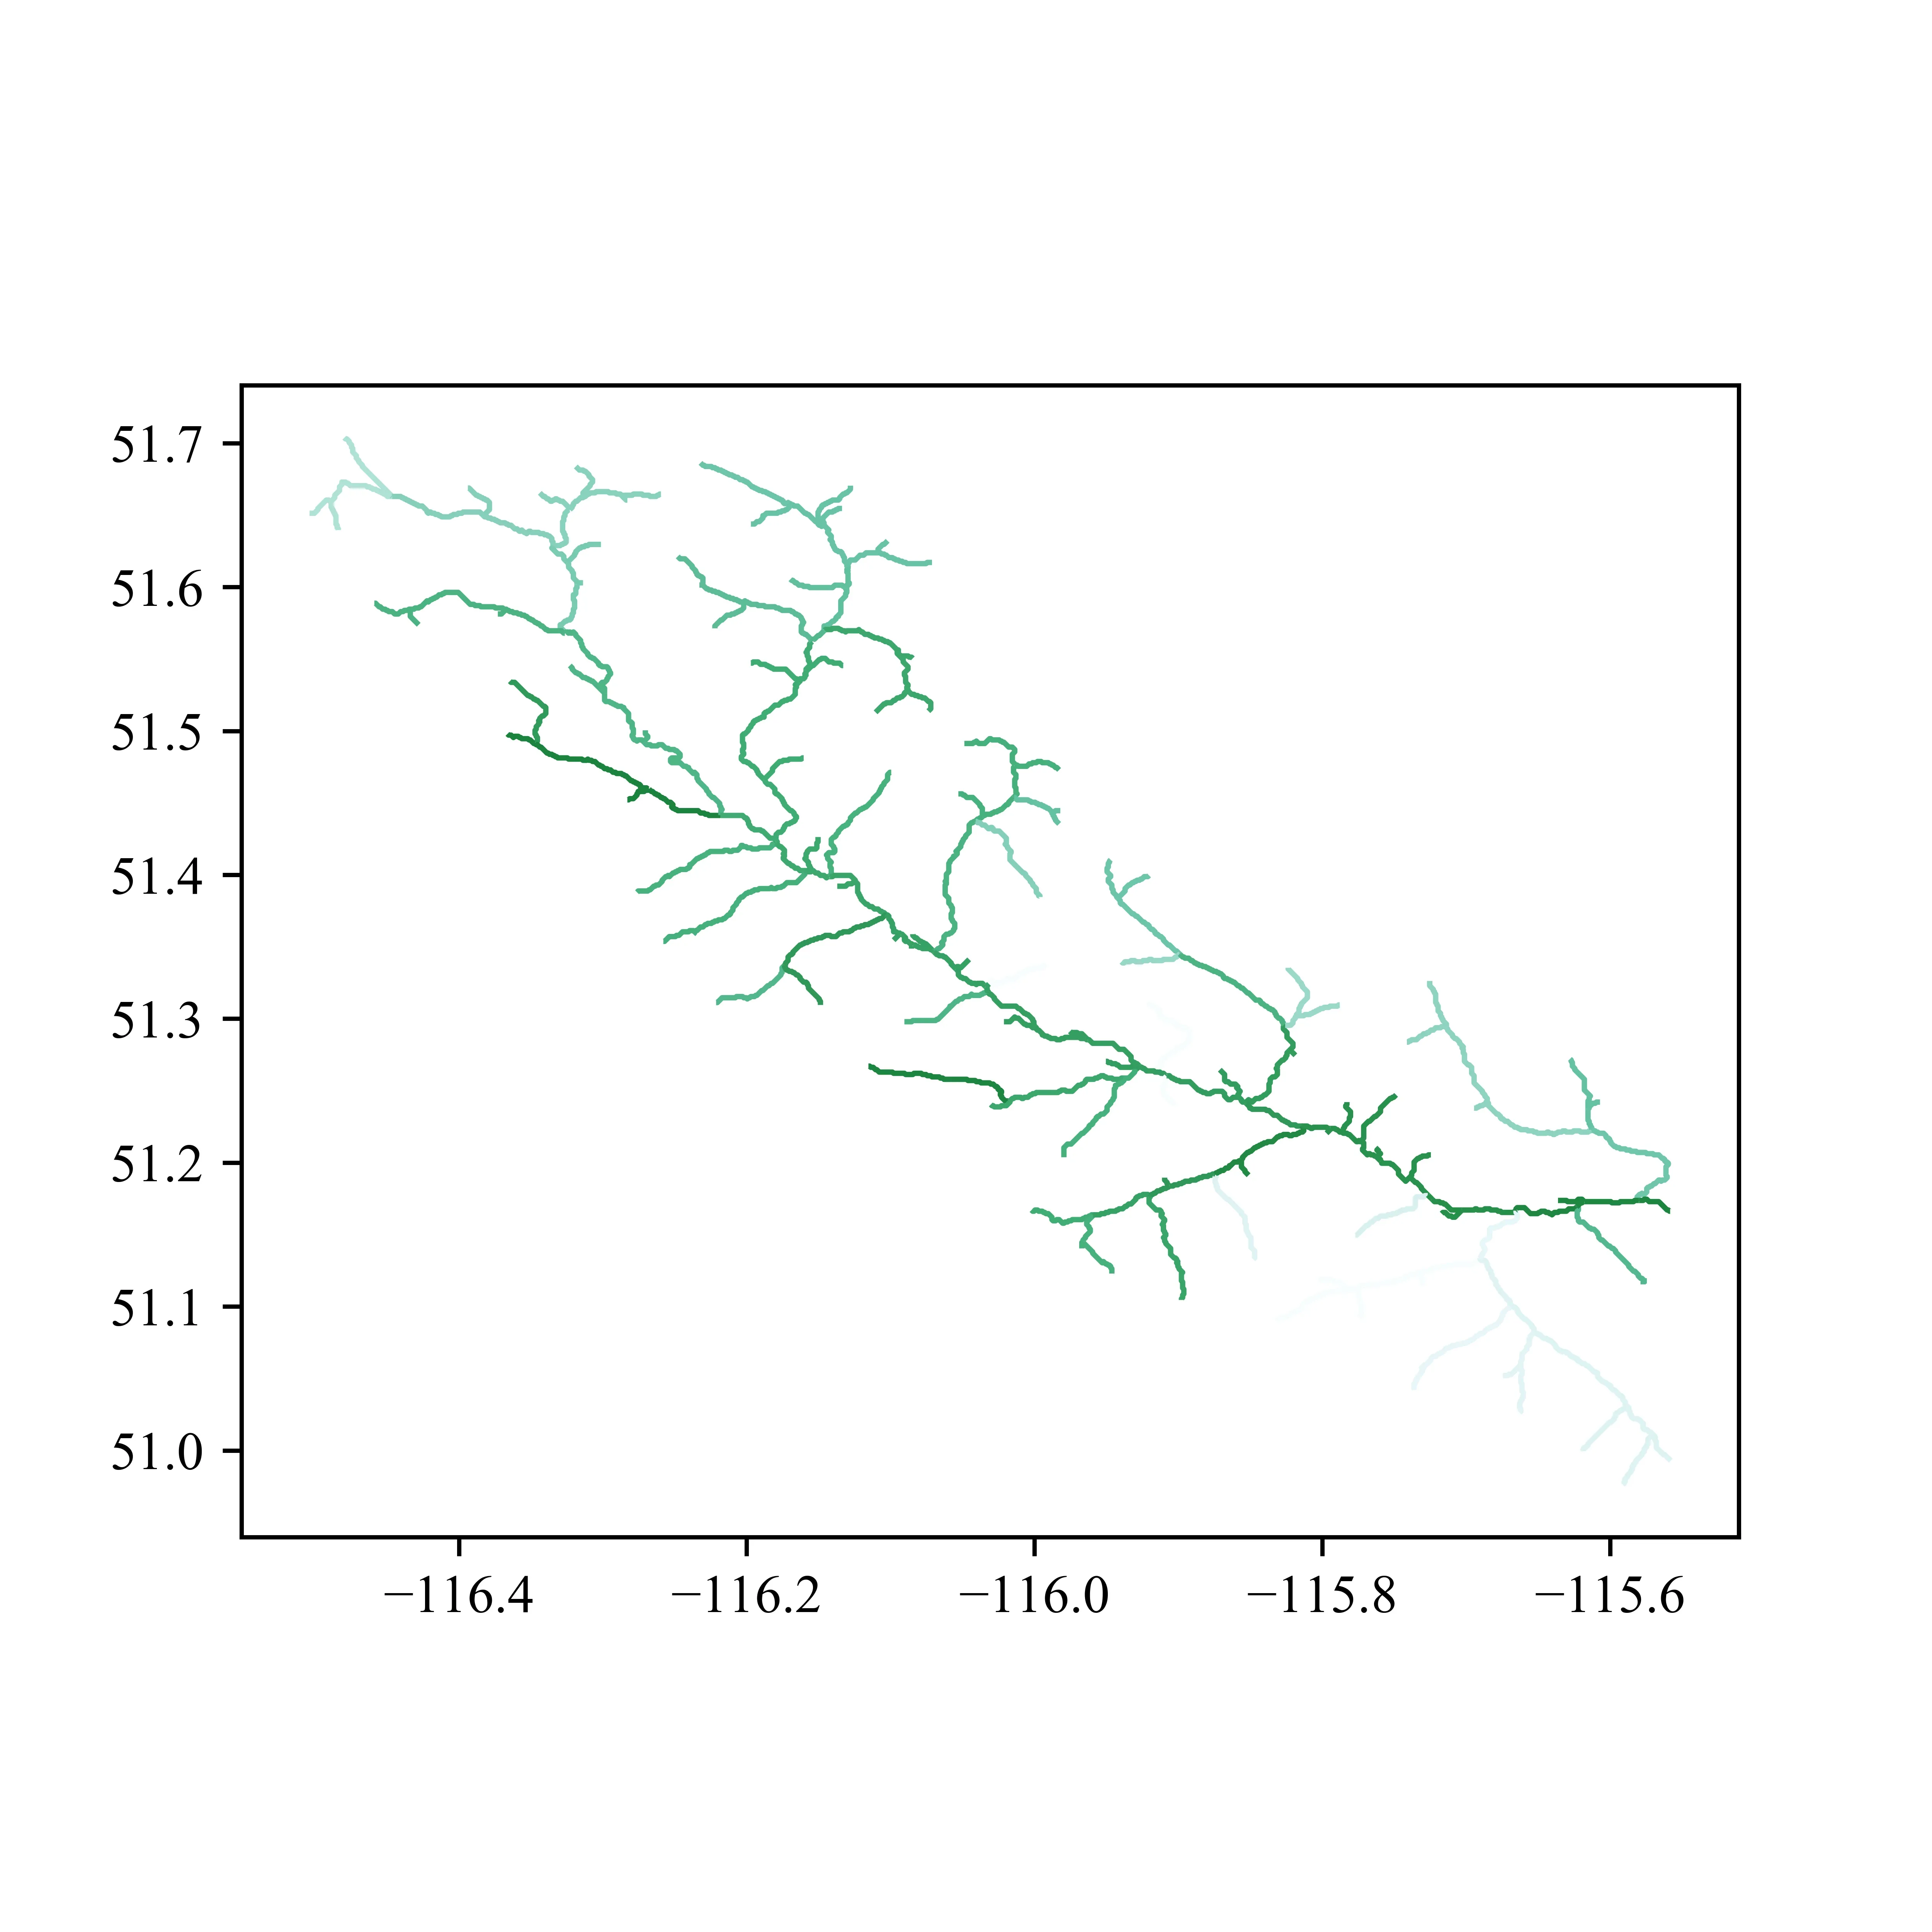
shp_sub.plot(column='Case1_2', cmap='BuGn', figsize=(5,5), linewidth=1, edgecolor='0.8', vmin=0, vmax=1)
当我尝试这样做时,我没有得到一对一的结果。
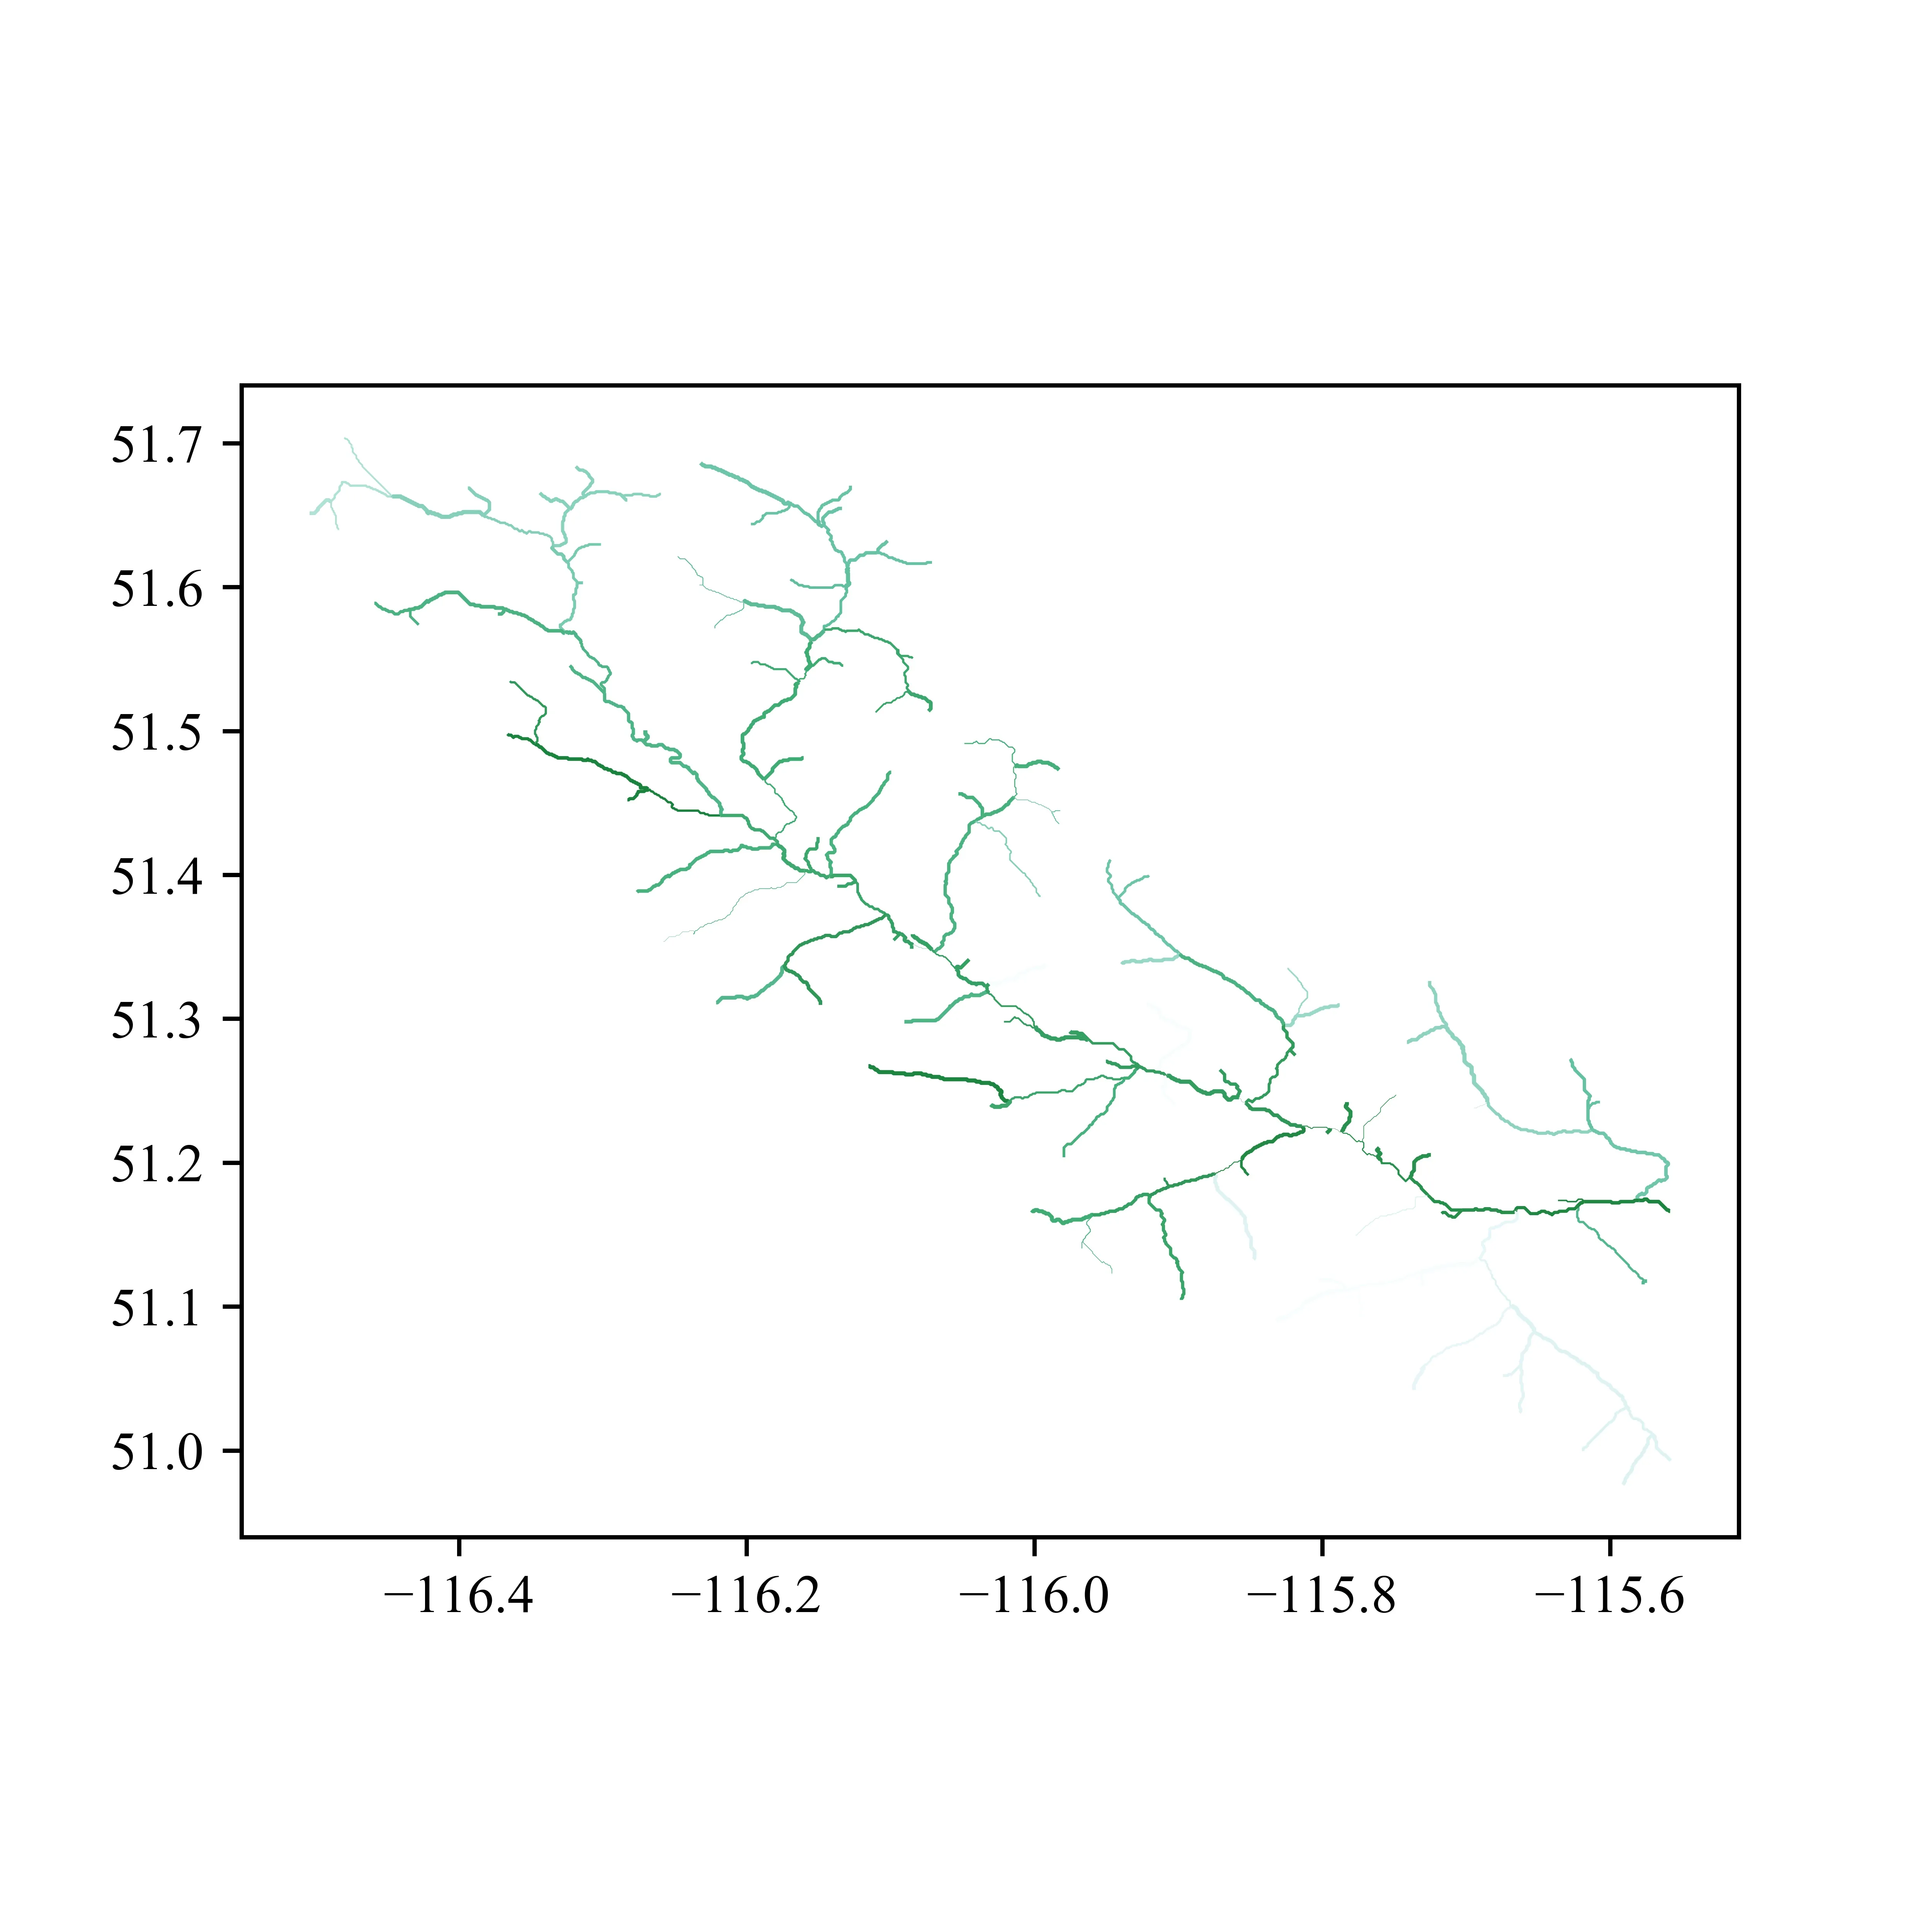
shp_sub.plot(column='Case1_2', cmap='BuGn', figsize=(5,5), linewidth=shp_sub['Case1_2'], edgecolor='0.8', vmin=0, vmax=1)