library(raster)
library(ggplot2)
map.shp <- getData('GADM', country='FRA', level=1)
plot(map.shp)
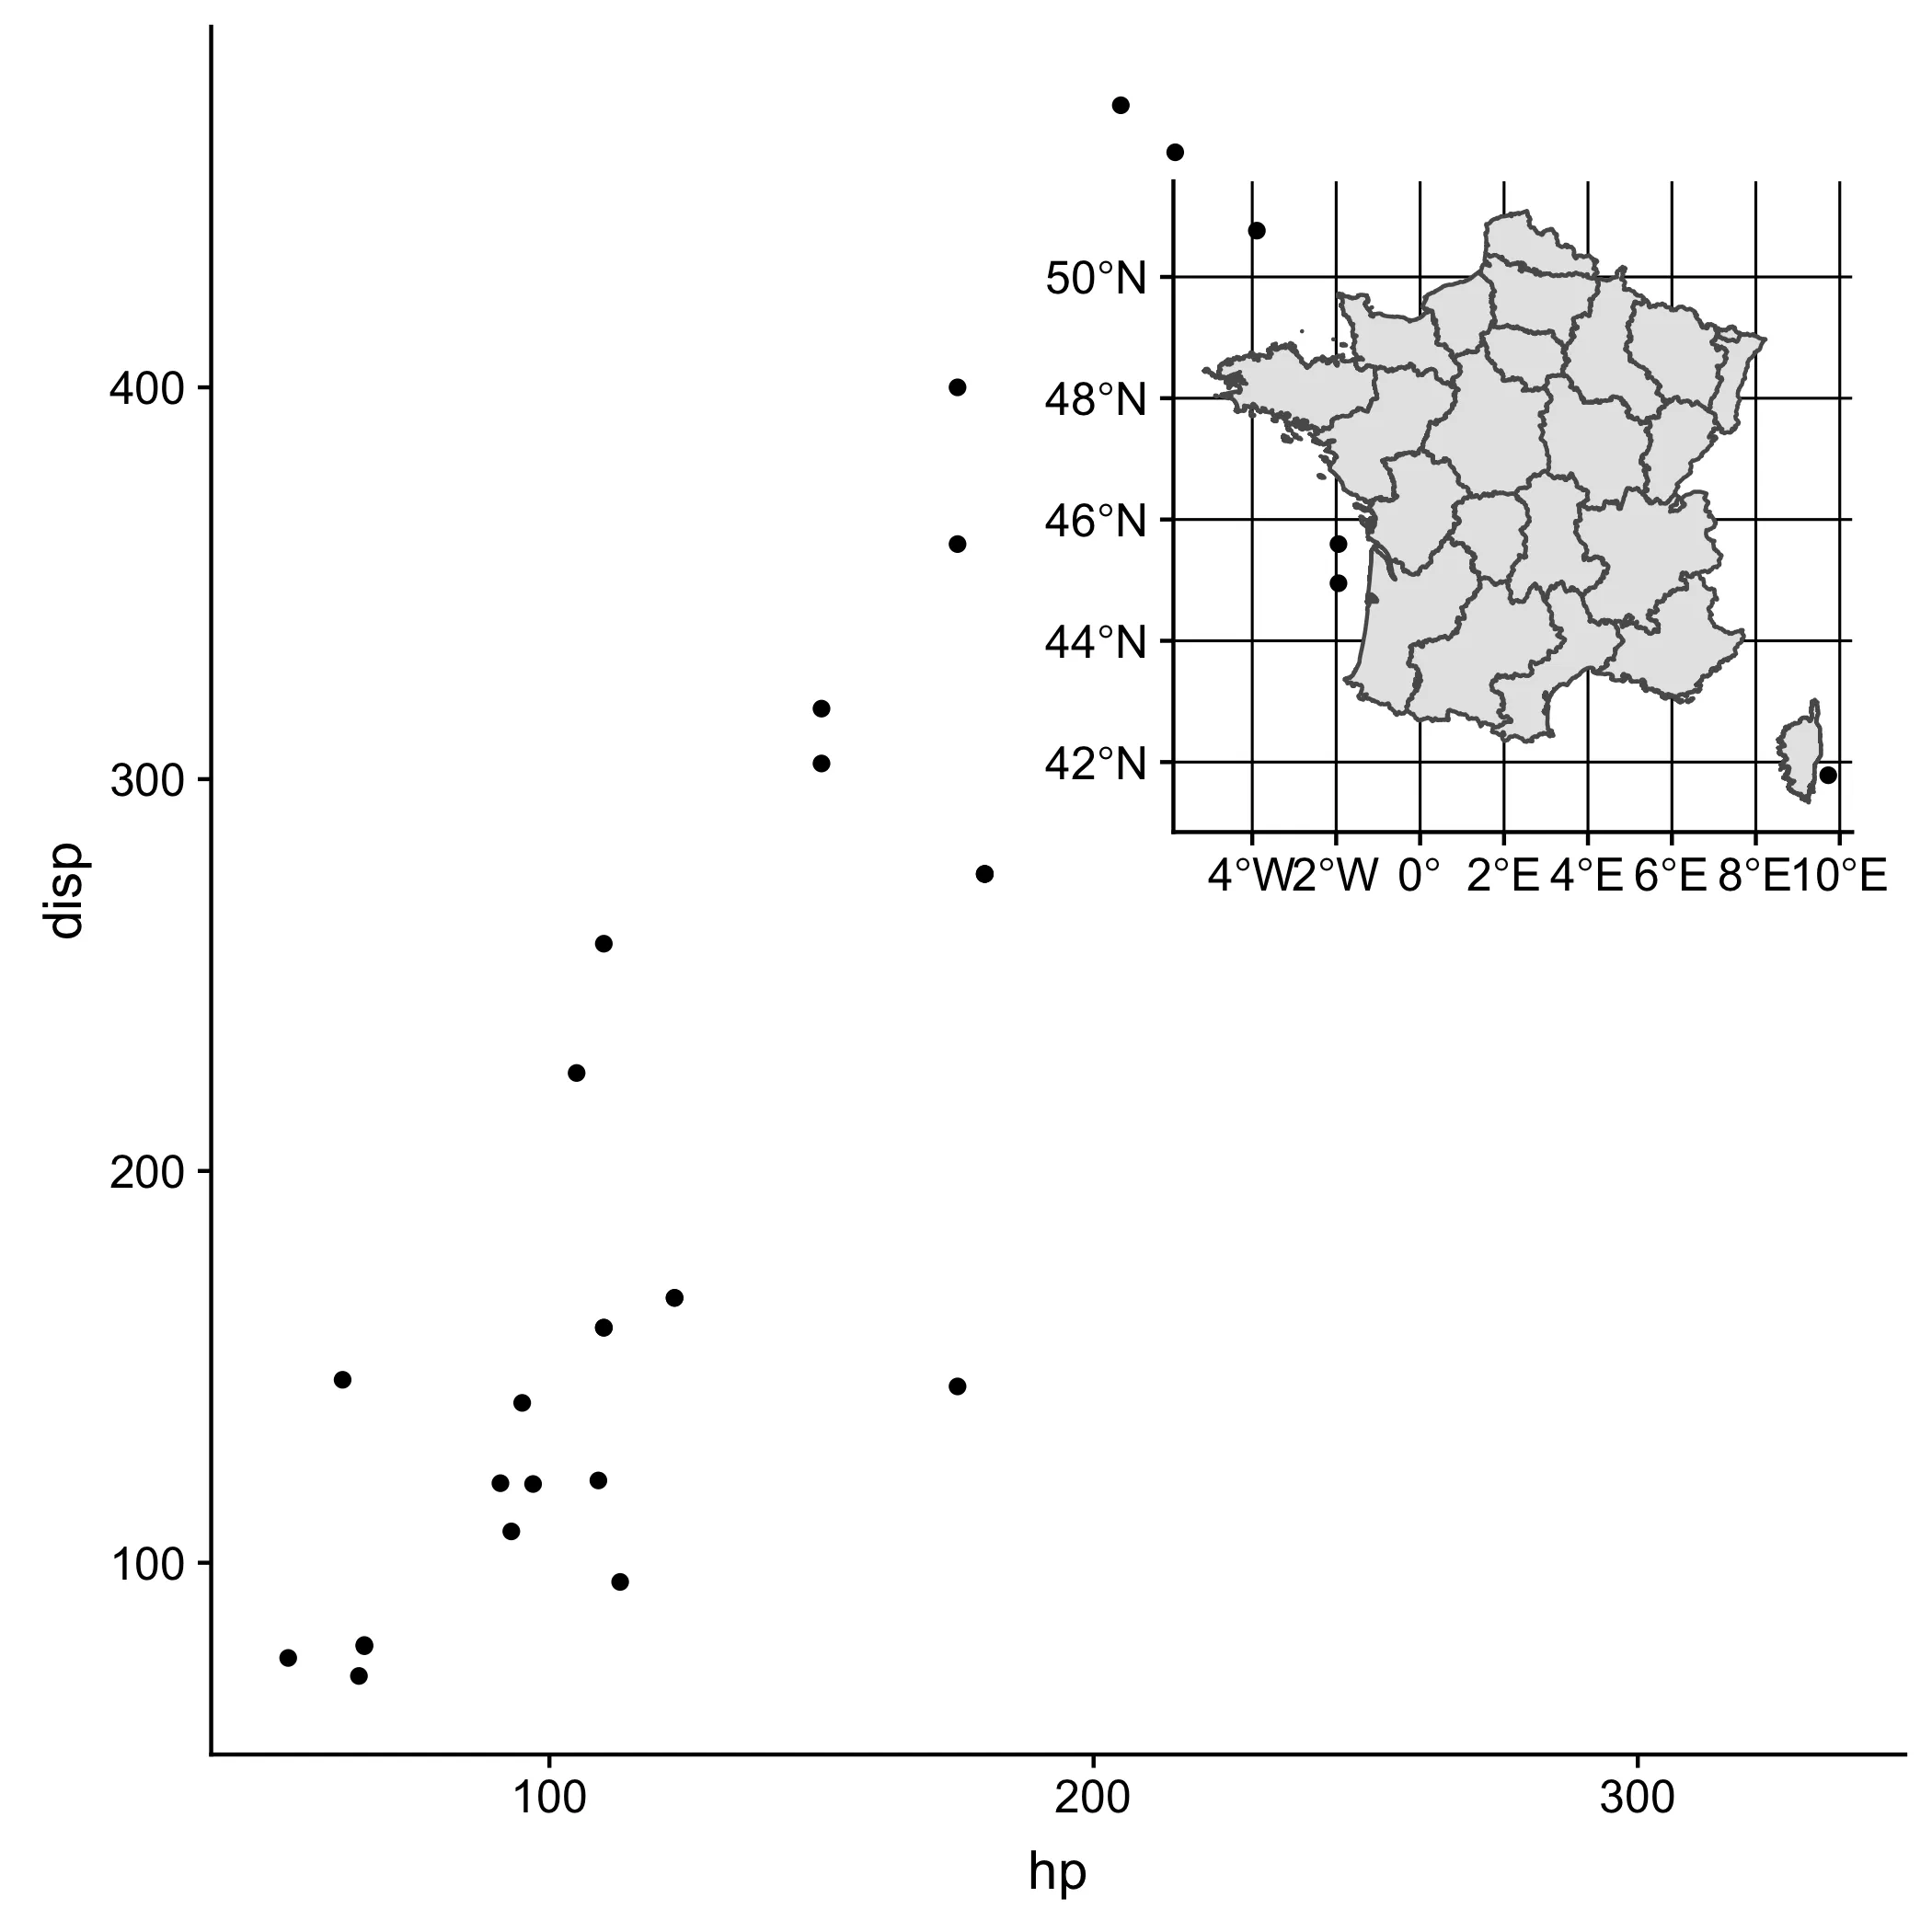
ggplot(mtcars, aes(x = hp, y = disp)) + geom_point()
我该如何将
map.shp 作为小插图放在 ggplot 的右侧?cowplot 和 ggdraw:sf 与 geom_sf,它们来自于 ggplot2 的开发版本,可在 devtools::install_github("hadley/ggplot2") 中获取。require(ggplot2)
require(cowplot)
require(sf)
require(raster)
map.shp <- getData('GADM', country='FRA', level=1) %>% st_as_sf()
plot.cars <- ggplot(mtcars, aes(x = hp, y = disp)) + geom_point()
plot.map <- ggplot() + geom_sf(data=map.shp)
inset_map <- ggdraw() +
draw_plot(plot.cars, 0, 0, 1, 1)+
draw_plot(plot.map, 0.5, 0.52, 0.5, 0.4)