我正尝试创建一个使用 ipywidget 和 matplotlib 图形的界面,它会在滑块改变时更新。原理上它是可用的,但总是多创建了一个图形。
以下是代码:
import numpy as np
import matplotlib.pyplot as plt
from ipywidgets import widgets
from IPython.display import display, clear_output

# make a grid

x = np.linspace(0, 5, 100)
X, Y = np.meshgrid(x, x)

# create the layout with slider

out = widgets.Output(layout=widgets.Layout(height='300px', width = '400px', border='solid'))
slider = widgets.IntSlider(value=1, min=1, max=5)
w = widgets.VBox(children=(out, slider))

# axes to plot into

ax = plt.axes()

display(w)

def update(value):
    i = slider.value
    Z = np.exp(-(X / i)**2 - (Y / i)**2)
    ax.pcolormesh(x, x, Z, vmin=0, vmax=1, shading='auto')
    with out:
        clear_output(wait=True)
        display(ax.figure)

slider.observe(update)
update(None)
以下是不期望的输出
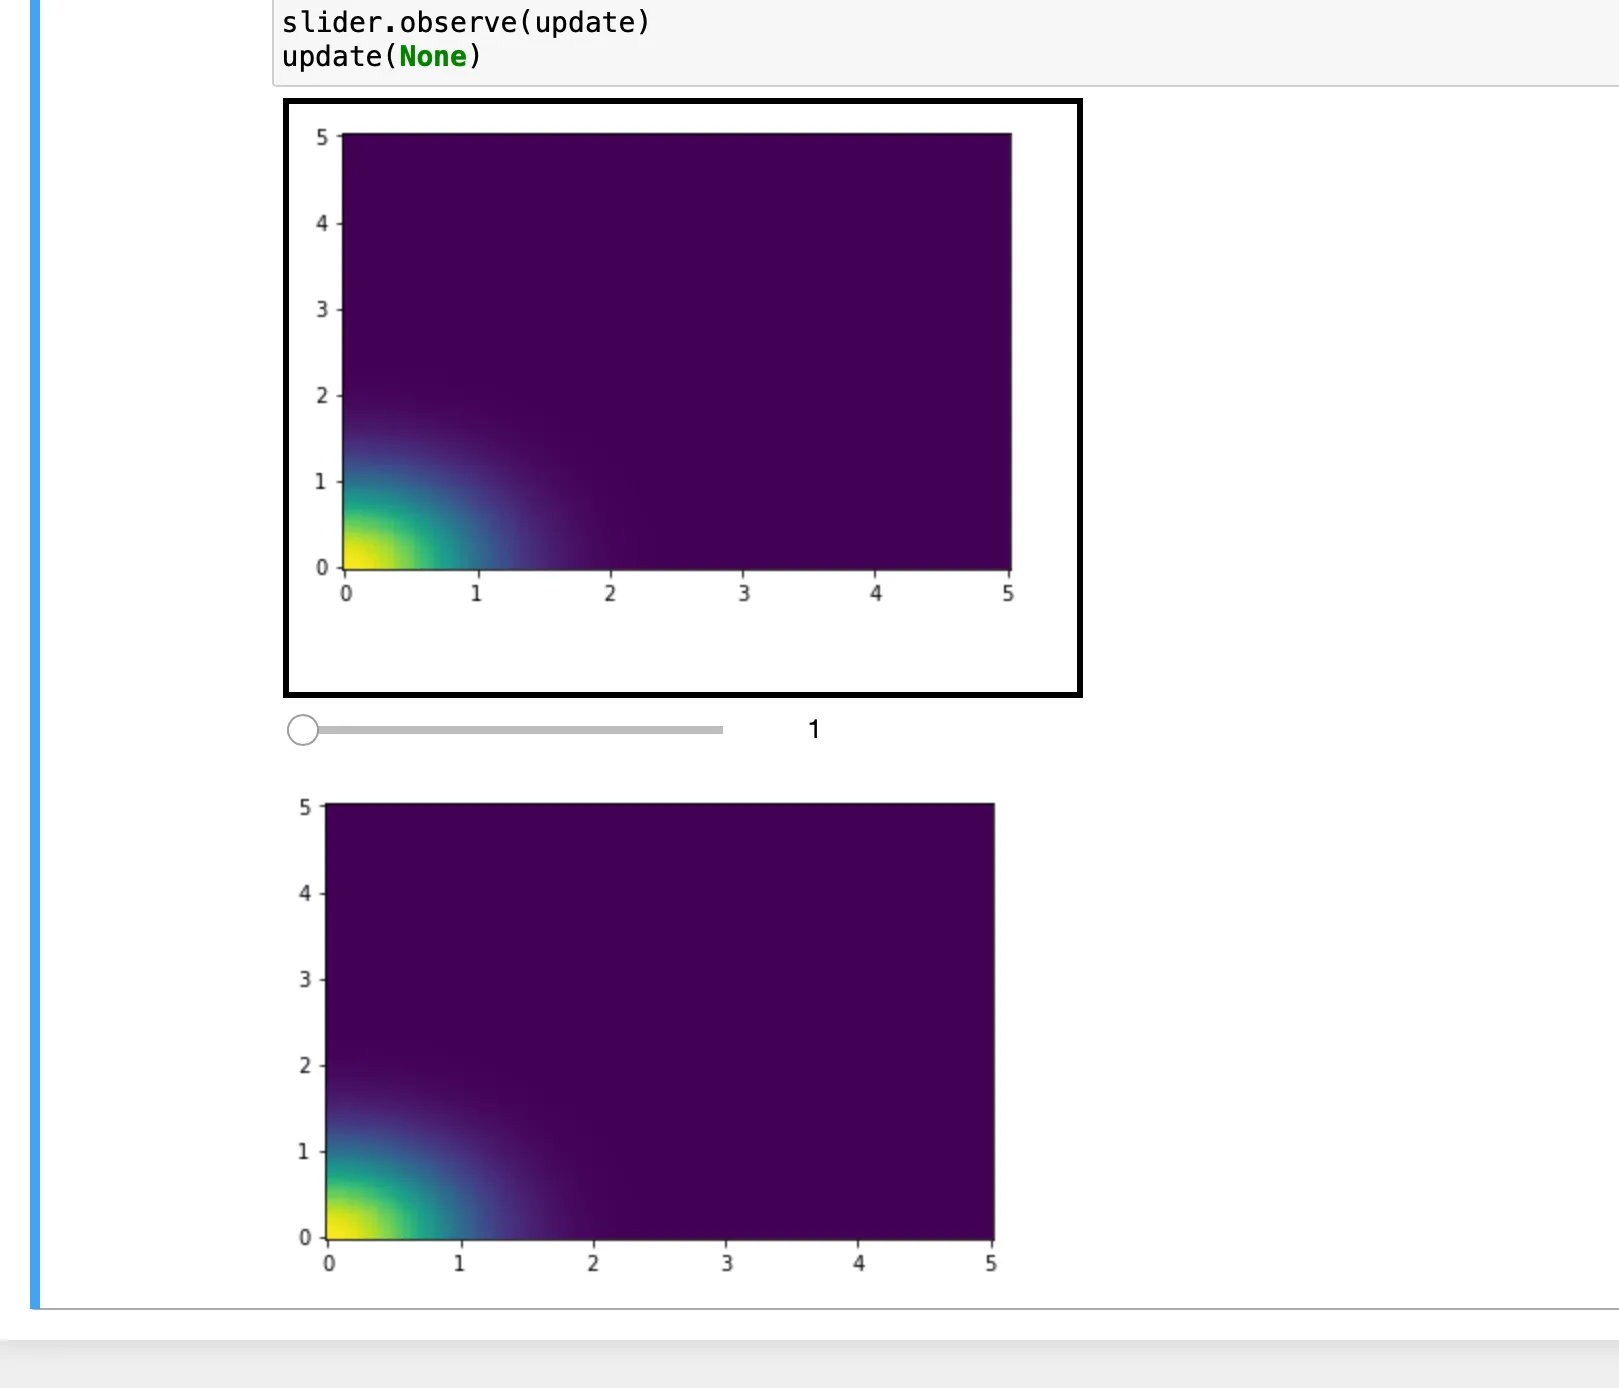
这个小部件能够正常工作,并且只有上半部分输出被更新,但我不明白为什么下半部分的输出也存在或如何摆脱它。我是否忽略了一些显而易见的东西?
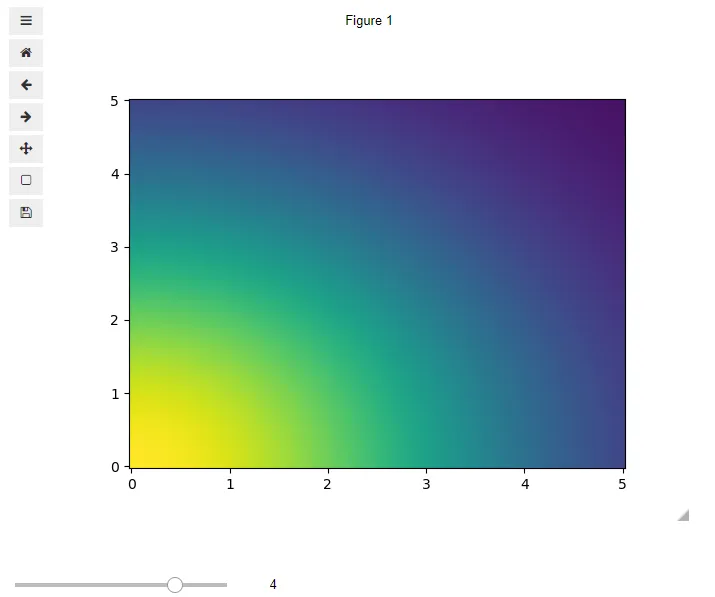

%matplotlib widget,你可以得到一个单独的图形,并且它会随着滑块的移动而更新。 - jayveesea