我遇到了以下问题:我正在使用显微镜保存16位tiff图像,需要对其进行分析。 我想使用numpy和matplotlib来处理,但是当我想要做一些简单的事情,例如在绿色中绘制图像(稍后我还需要叠加其他图像),它就失败了。
这里是一个例子,当我尝试将图像绘制为RGB数组或使用默认的jet色图时。
import numpy as np
import matplotlib.pyplot as plt
import cv2

imageName = 'image.tif'

# image as luminance
img1 = cv2.imread(imageName,-1)

# image as RGB array
shape = (img1.shape[0], img1.shape[1], 3)
img2 = np.zeros(shape,dtype='uint16')
img2[...,1] += img1

fig = plt.figure(figsize=(20,8))
ax1 = fig.add_subplot(1,2,1)
ax2 = fig.add_subplot(1,2,2)

im1 = ax1.imshow(img1,interpolation='none')
im2 = ax2.imshow(img2,interpolation='none')
fig.show()
对我来说,它呈现出以下的图像: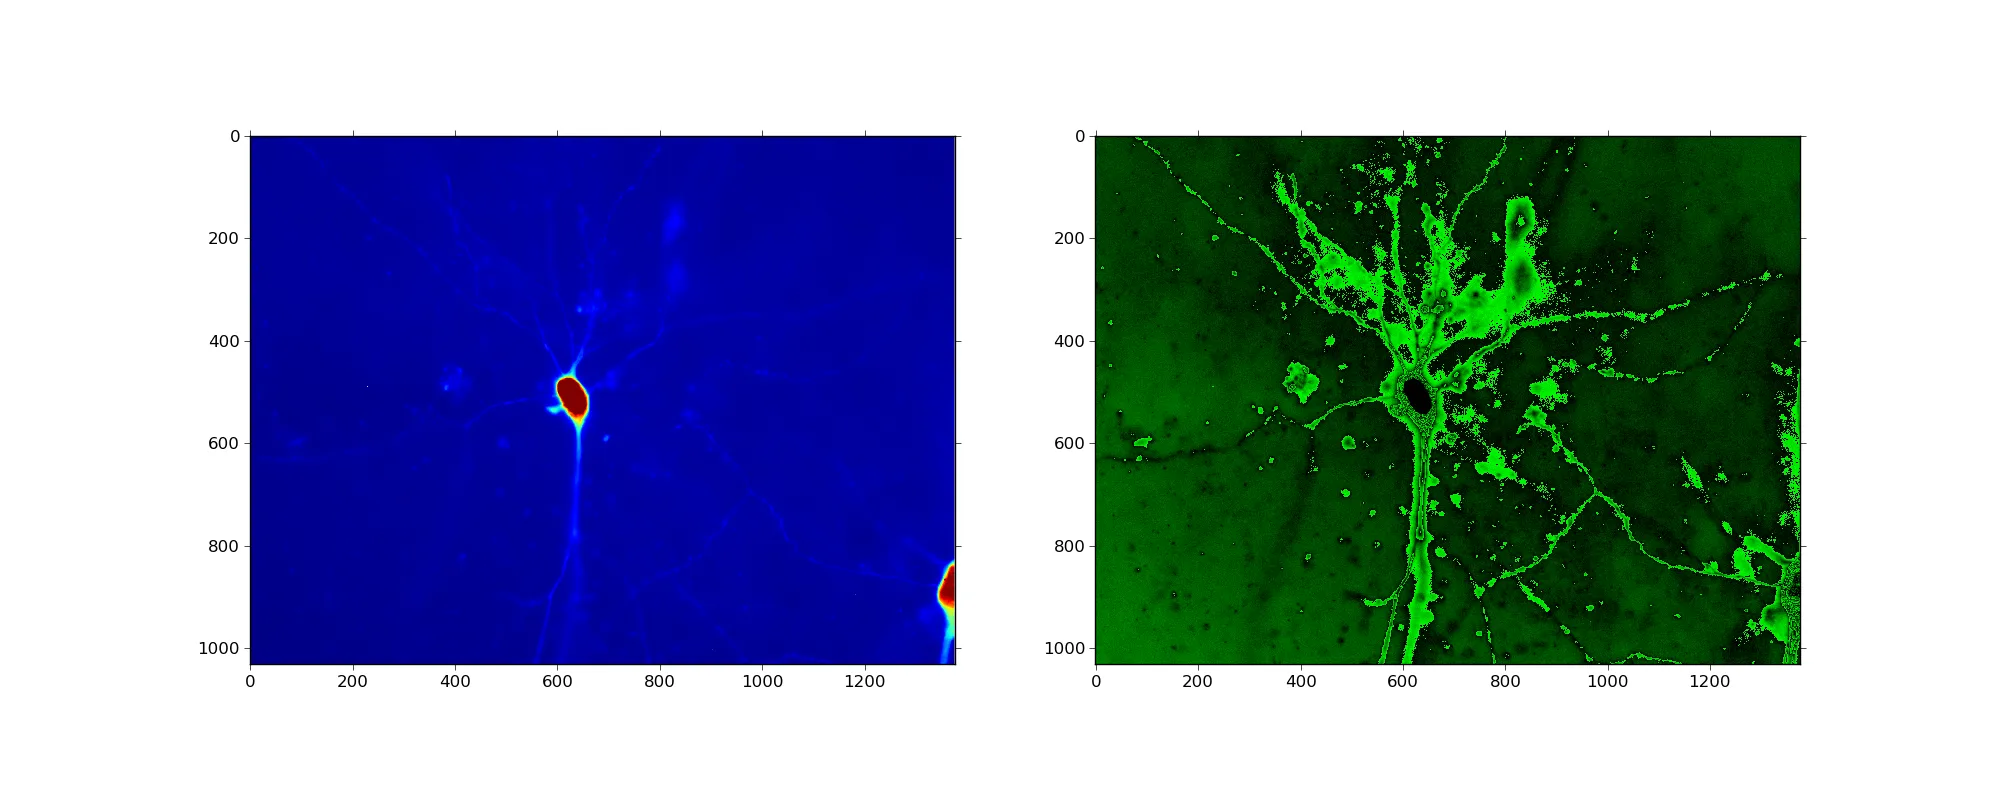
如果这个问题太基础了,我很抱歉,但我不知道右边的图是为什么显示这些伪影。我想使用绿色尺度,得到类似于左图的图形(ImageJ也会生成类似于左图的结果)。
非常感谢您的合作。
img2中uint16值溢出的结果。print img1.dtype输出什么?print img1.min(), img1.max()呢? - Joe Kington