我相信seaborn希望使用RGBA颜色格式,因此我给它提供了一个matplotlib中类似的RGBA元组列表,但它不喜欢。 我尝试做类似于g = sns.jointplot(plotdataandstuff)之类的事情,但我无法弄清楚如何操作<seaborn.axisgrid.JointGrid at 0x135943d30>对象。
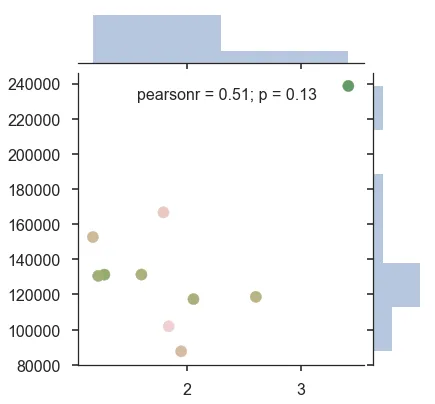
u = np.array([ 3.41959, 1.79315, 1.17229, 1.59909, 1.27337, 1.21917, 2.60591, 2.0571 , 1.83865, 1.94869])
v = np.array([238614, 166714, 152668, 131310, 131249, 130562, 118618, 117329, 101841, 87626])
c = np.array([(0.38998137426811552, 0.61096214975059782, 0.40096663322878834, 1.0),
              (0.91819597903385741, 0.79247826098536023, 0.76754610185633376, 1.0),
              (0.80693280982205806, 0.72756928157840872, 0.59917426429032361, 1.0),
              (0.67210067882600855, 0.69086449405289441, 0.48640673089730696, 1.0),
              (0.57590730770024134, 0.66895624366124595, 0.43845220910273563, 1.0),
              (0.63252315055536124, 0.68193477278802606, 0.4639878928469835, 1.0), (
                  0.72522872317321141, 0.70350066480196072, 0.52329091024506846, 1.0),
              (0.67210067882600855, 0.69086449405289441, 0.48640673089730696, 1.0),
              (0.93684201381384091, 0.81480601869516889, 0.81083911715694279, 1.0),
              (0.83654311363401856, 0.73919037695009648, 0.63434086709274395, 1.0)], dtype=object)
sns.jointplot(x=u, y=v, color=c)
这里是错误信息
TypeError                                 Traceback (most recent call last)
/Users/jespinoz/anaconda/lib/python3.5/site-packages/matplotlib/colors.py in to_rgba(c, alpha)
    140     try:
--> 141         rgba = _colors_full_map.cache[c, alpha]
    142     except (KeyError, TypeError):  # Not in cache, or unhashable.

TypeError: unhashable type: 'numpy.ndarray'

During handling of the above exception, another exception occurred:

TypeError                                 Traceback (most recent call last)
/Users/jespinoz/anaconda/lib/python3.5/site-packages/matplotlib/colors.py in _to_rgba_no_colorcycle(c, alpha)
    191     try:
--> 192         c = tuple(map(float, c))
    193     except TypeError:

TypeError: only length-1 arrays can be converted to Python scalars

During handling of the above exception, another exception occurred:

ValueError                                Traceback (most recent call last)
<ipython-input-69-48b550e1edb6> in <module>()
     13               (0.93684201381384091, 0.81480601869516889, 0.81083911715694279, 1.0),
     14               (0.83654311363401856, 0.73919037695009648, 0.63434086709274395, 1.0)], dtype=object)
---> 15 sns.jointplot(x=u, y=v, color=c)

/Users/jespinoz/anaconda/lib/python3.5/site-packages/seaborn/distributions.py in jointplot(x, y, data, kind, stat_func, color, size, ratio, space, dropna, xlim, ylim, joint_kws, marginal_kws, annot_kws, **kwargs)
    789     if color is None:
    790         color = color_palette()[0]
--> 791     color_rgb = mpl.colors.colorConverter.to_rgb(color)
    792     colors = [set_hls_values(color_rgb, l=l) for l in np.linspace(1, 0, 12)]
    793     cmap = blend_palette(colors, as_cmap=True)

/Users/jespinoz/anaconda/lib/python3.5/site-packages/matplotlib/colors.py in to_rgb(arg)
    307         if *arg* is *RGBA*, the *A* will simply be discarded.
    308         """
--> 309         return to_rgb(arg)
    310
    311     @staticmethod

/Users/jespinoz/anaconda/lib/python3.5/site-packages/matplotlib/colors.py in to_rgb(c)
    242     """Convert `c` to an RGB color, silently dropping the alpha channel.
    243     """
--> 244     return to_rgba(c)[:3]
    245
    246

/Users/jespinoz/anaconda/lib/python3.5/site-packages/matplotlib/colors.py in to_rgba(c, alpha)
    141         rgba = _colors_full_map.cache[c, alpha]
    142     except (KeyError, TypeError):  # Not in cache, or unhashable.
--> 143         rgba = _to_rgba_no_colorcycle(c, alpha)
    144         try:
    145             _colors_full_map.cache[c, alpha] = rgba

/Users/jespinoz/anaconda/lib/python3.5/site-packages/matplotlib/colors.py in _to_rgba_no_colorcycle(c, alpha)
    192         c = tuple(map(float, c))
    193     except TypeError:
--> 194         raise ValueError("Invalid RGBA argument: {!r}".format(orig_c))
    195     if len(c) not in [3, 4]:
    196         raise ValueError("RGBA sequence should have length 3 or 4")

ValueError: Invalid RGBA argument: array([[0.3899813742681155, 0.6109621497505978, 0.40096663322878834, 1.0],
       [0.9181959790338574, 0.7924782609853602, 0.7675461018563338, 1.0],
       [0.8069328098220581, 0.7275692815784087, 0.5991742642903236, 1.0],
       [0.6721006788260085, 0.6908644940528944, 0.48640673089730696, 1.0],
       [0.5759073077002413, 0.668956243661246, 0.43845220910273563, 1.0],
       [0.6325231505553612, 0.6819347727880261, 0.4639878928469835, 1.0],
       [0.7252287231732114, 0.7035006648019607, 0.5232909102450685, 1.0],
       [0.6721006788260085, 0.6908644940528944, 0.48640673089730696, 1.0],
       [0.9368420138138409, 0.8148060186951689, 0.8108391171569428, 1.0],
       [0.8365431136340186, 0.7391903769500965, 0.634340867092744, 1.0]], dtype=object)