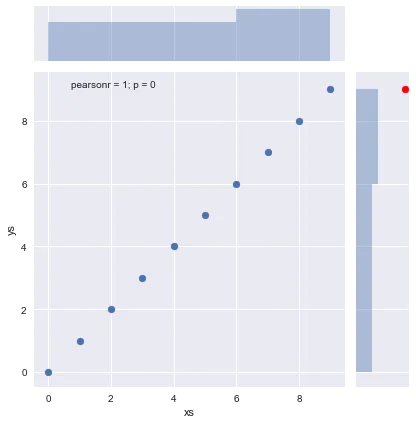
我试图在Seaborn的jointplot上只突出显示一个点,但是我没有成功。虽然能够在matplotlib上显示该点,但它并未出现在同一张图表上。请问我做错了什么?谢谢!
import seaborn as sns
import matplotlib.pyplot as plt
%matplotlib inline
import pandas as pd

#make some sample data
test_x = [i for i in range(10)]
test_y = [j for j in range(10)]

df = pd.DataFrame({'xs':test_x,
                  'ys':test_y})

#make Seaborn chart
g = sns.jointplot(x="xs", y="ys", data = df)


#sort the table to find the top y value
df = df.sort_values('ys', ascending = False)

#find coordinates of this point
highlight_x = df.iloc[0,0]
highlight_y = df.iloc[0,1]

#this is wrong - I want it to be in the same chart
plt.scatter(highlight_x, highlight_y, color = 'red')

plt.show()