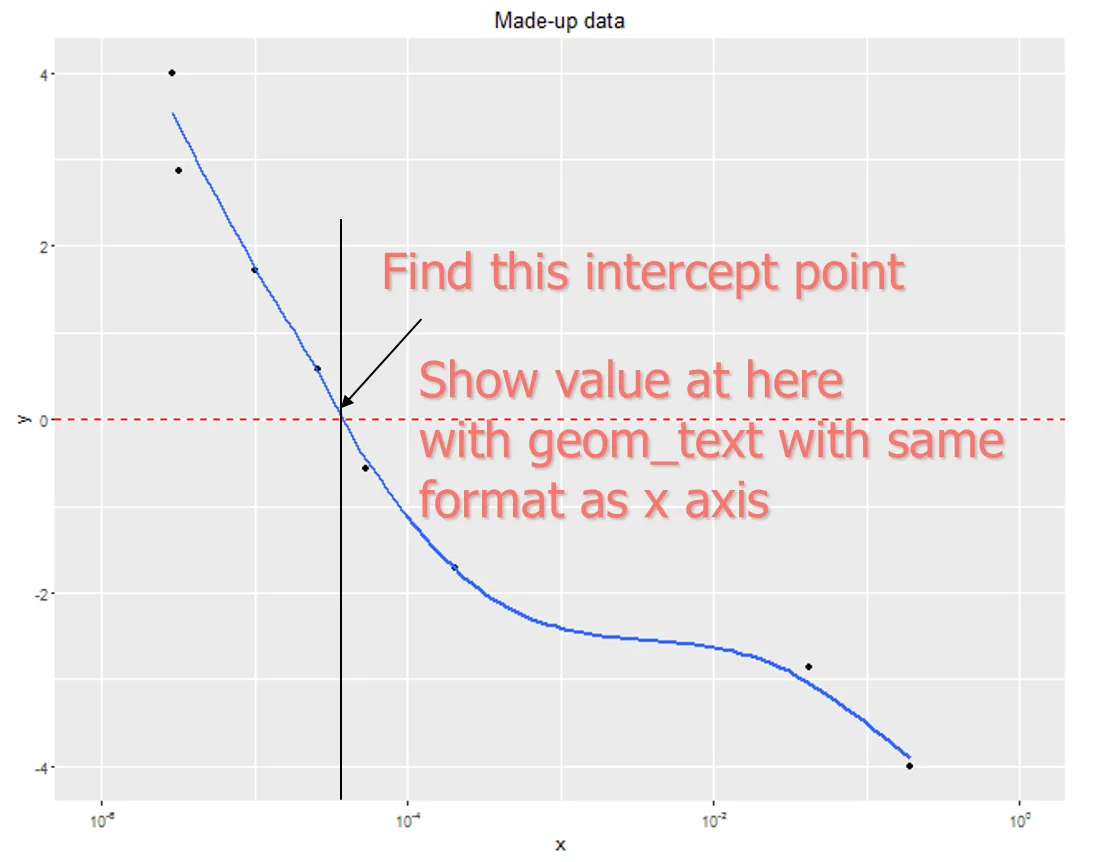
我有一个非常简单的问题,但到目前为止还没有找到简单的解决方案。假设我有一些数据要拟合,并显示y在特定值时的x轴值。在这种情况下,假设当y=0时x的值是多少。模型很简单,是y~x进行拟合,但我不知道如何从中估计x的值。无论如何,
样本数据
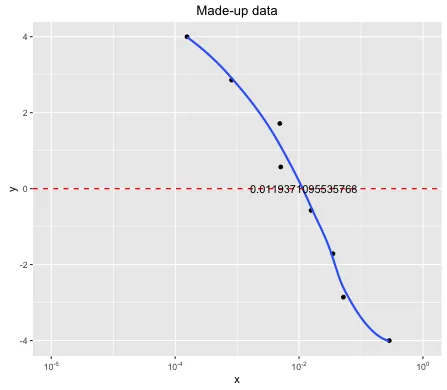
我想将1e-10的输入转换为10^-10的格式,并在图表上加注释,就像我在图表中指示的那样。
提前感谢!
样本数据
library(ggplot2)
library(scales)
df = data.frame(x= sort(10^runif(8,-6,1),decreasing=TRUE), y = seq(-4,4,length.out = 8))

ggplot(df, aes(x = x, y = y)) +
  geom_point() +
  #geom_smooth(method = "lm", formula = y ~ x, size = 1,linetype="dashed",  col="black",se=FALSE, fullrange = TRUE)+
  geom_smooth(se=FALSE)+
  labs(title = "Made-up data") +
  scale_x_log10(breaks =  c(1e-6,1e-4,1e-2,1),
                labels = trans_format("log10", math_format(10^.x)),limits = c(1e-6,1))+
  geom_hline(yintercept=0,linetype="dashed",colour="red",size=0.6)
我想将1e-10的输入转换为10^-10的格式,并在图表上加注释,就像我在图表中指示的那样。
提前感谢!
ggplot2是一个图形工具,而不是一个建模工具。你必须重新创建模型,然后使用predict函数对感兴趣的x进行预测。 - Vincent Bonhomme