我有一些无向图:
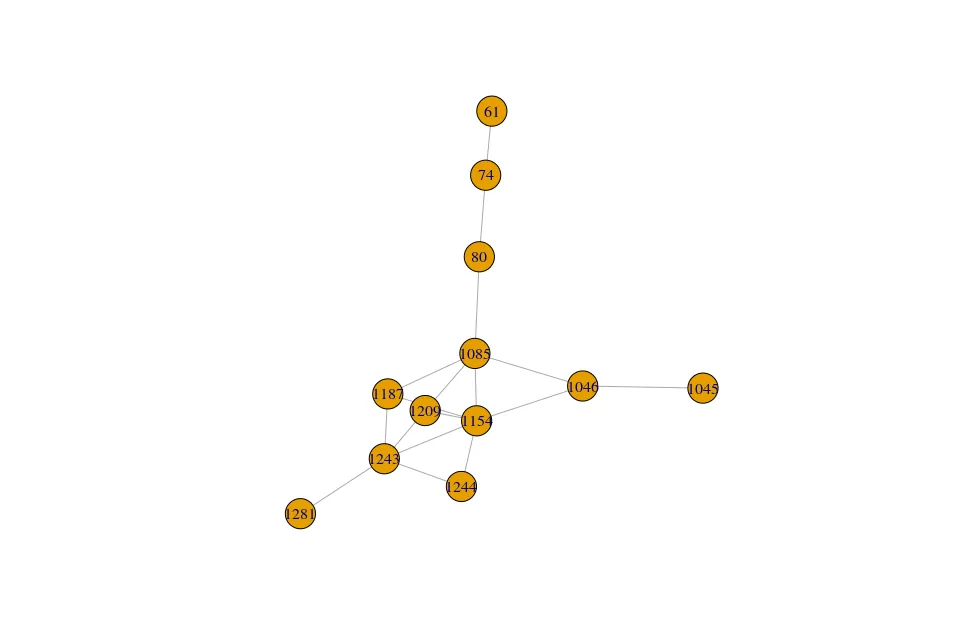
get.data.frame(out)
   from   to  value sourceID targetID
1    74   80 0.2829   255609   262854
2    74   61 0.2880   255609   179585
3    80 1085 0.2997   262854  3055482
4  1045 1046 0.1842  2970629  2971615
5  1046 1085 0.2963  2971615  3055482
6  1046 1154 0.2714  2971615  3087803
7  1085 1154 0.2577  3055482  3087803
8  1085 1187 0.2850  3055482  3101131
9  1085 1209 0.2850  3055482  3110186
10 1154 1243 0.2577  3087803  3130848
11 1154 1187 0.2305  3087803  3101131
12 1154 1209 0.2305  3087803  3110186
13 1154 1244 0.2577  3087803  3131379
14 1243 1187 0.1488  3130848  3101131
15 1243 1209 0.1488  3130848  3110186
16 1243 1244 0.1215  3130848  3131379
17 1243 1281 0.2997  3130848  3255811

> out
IGRAPH UN-- 12 17 --
+ attr: name (v/c), color (v/n), value (e/n), sourceID (e/n), targetID (e/n)
+ edges (vertex names):
 [1] 74  --80   74  --61   80  --1085 1045--1046 1046--1085 1046--1154 1085--1154 1085--1187 1085--1209 1154--1243 1154--1187 1154--1209
[13] 1154--1244 1243--1187 1243--1209 1243--1244 1243--1281
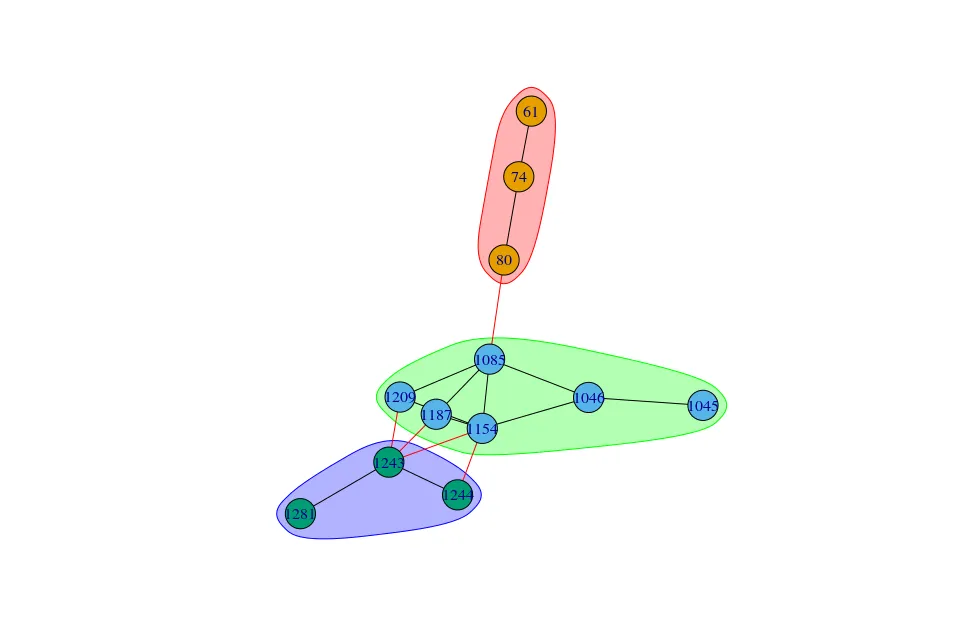
我正在使用两种社区检测方法。
使用
edge.betweenness.community,我可以通过计算边介数来分割社区。wc <- edge.betweenness.community(out, weights = E(out)$value, directed = FALSE, bridges=TRUE)
plot(wc, out)
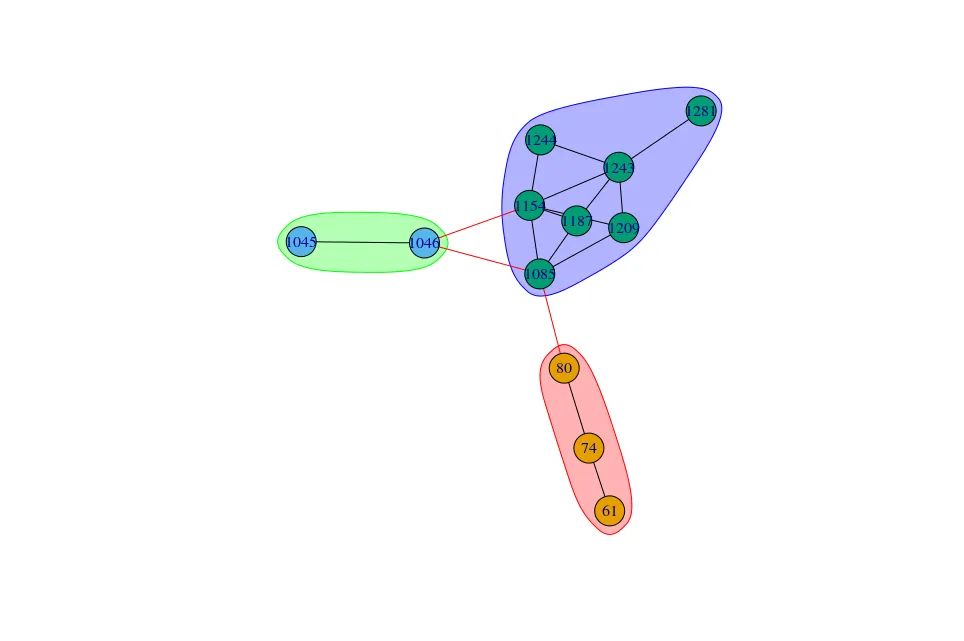
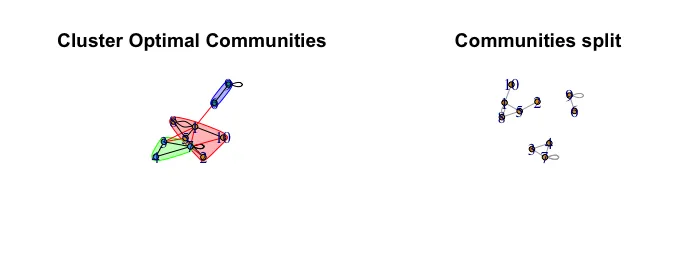
使用cluster_optimal,我可以通过最大化模块度来分割社区:
co <- cluster_optimal(out, weights = E(out)$value)
plot(co, out)
关于 co 的数据:
> co
IGRAPH clustering optimal, groups: 3, mod: 0.27
+ groups:
  $`1`
  [1] "74" "80" "61"

  $`2`
  [1] "1045" "1046" "1085" "1154" "1187" "1209"

  $`3`
  [1] "1243" "1244" "1281"
对于
edge.betweenness.community,我可以通过返回需要切断的边来实现此操作:wc$removed.edges
[1] 3 6 5 17 14 11 8 15 7 12 1 2 4 9 10 13 16
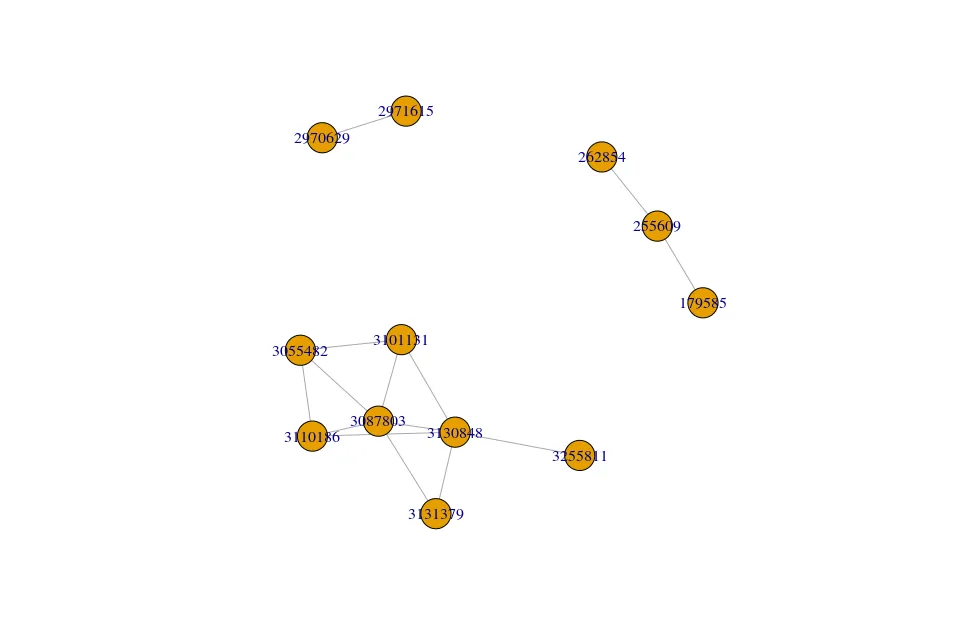
我可以然后剪掉那些边缘:
g2<-delete.edges(out, wc$removed.edges[seq(length=which.max(mods)-1)])
plot(g2)
但如果我尝试对cluster_optimal这样做:
co$removed.edges
NULL
看起来 cluster_optimal 没有属性 removed$edges
然后我查看了文档 (http://igraph.org/r/doc/communities.html) 并尝试了 cut_at 和 cutat:
> cutat(co, 3)
Error in cutat(co, 3) : Not a hierarchical communitity structure
> cut_at(co, 3)
Error in cut_at(co, 3) : Not a hierarchical communitity structure
这也没有起作用,尽管
co应该是一个社区对象。
我该如何像使用edge.betweenness.community一样将我的cluster_optimal图分割成单独的社区?
尝试了发布的建议后,当我尝试执行时
crossing(co, out)
我收到了错误信息:
Error: Each element must be either an atomic vector or a data     frame
.Problems: co, out.
R version 3.4.0 (2017-04-21)
Platform: x86_64-pc-linux-gnu (64-bit)
Running under: Ubuntu 14.04.5 LTS

Matrix products: default
BLAS: /usr/lib/libblas/libblas.so.3.0
LAPACK: /usr/lib/lapack/liblapack.so.3.0

locale:
 [1] LC_CTYPE=en_US.UTF-8       LC_NUMERIC=C               LC_TIME=en_US.UTF-8        LC_COLLATE=en_US.UTF-8     LC_MONETARY=en_US.UTF-8
 [6] LC_MESSAGES=en_US.UTF-8    LC_PAPER=en_US.UTF-8       LC_NAME=C                  LC_ADDRESS=C               LC_TELEPHONE=C
[11] LC_MEASUREMENT=en_US.UTF-8 LC_IDENTIFICATION=C

attached base packages:
[1] stats     graphics  grDevices utils     datasets  methods   base

other attached packages:
 [1] plotly_4.7.0        ggplot2_2.2.1       tidyr_0.6.2         dtplyr_0.0.2        data.table_1.10.4   DT_0.2
 [7] reshape2_1.4.2      igraph_1.0.1        dplyr_0.5.0         htmlwidgets_0.8     networkD3_0.4       htmltools_0.3.6
[13] formattable_0.2.0.1

loaded via a namespace (and not attached):
 [1] Rcpp_0.12.10      compiler_3.4.0    plyr_1.8.4        tools_3.4.0       digest_0.6.12     jsonlite_1.4      evaluate_0.10
 [8] tibble_1.3.0      gtable_0.2.0      viridisLite_0.2.0 lattice_0.20-35   Matrix_1.2-10     DBI_0.6-1         stringr_1.2.0
[15] httr_1.2.1        knitr_1.15.1      rprojroot_1.2     grid_3.4.0        R6_2.2.0          rmarkdown_1.5     purrr_0.2.2
[22] magrittr_1.5      backports_1.0.5   scales_0.4.1      assertthat_0.2.0  colorspace_1.3-2  stringi_1.1.5     lazyeval_0.2.0
[29] munsell_0.4.3
out的数据。 - Chuck错误:每个元素必须是原子向量或数据框。问题:co。我已经更新了我的数据和co的结果数据。 - Chuckcrossing(co, out)- Chucktidyr,这掩盖了来自igraph的crossing函数。卸载此软件包后,您的解决方案正常工作。非常感谢您的原始答案和评论中的帮助。祝你有愉快的一天 :) - Chuck