绘制数据的2.5%分位数和97.5%分位数。

3

我正在处理时间序列数据,为了说明问题,我将编造一些数据。

import pandas as pd
import numpy as np
from numpy.random import randint
import matplotlib.pyplot as plt

rng = pd.date_range('10/9/2018 00:00', periods=10, freq='1H')
df = pd.DataFrame({'Random_Number':randint(1, 100, 10)}, index=rng)

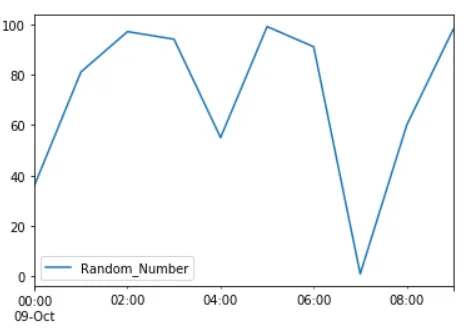
如果我绘制它,看起来像这样:df.plot()
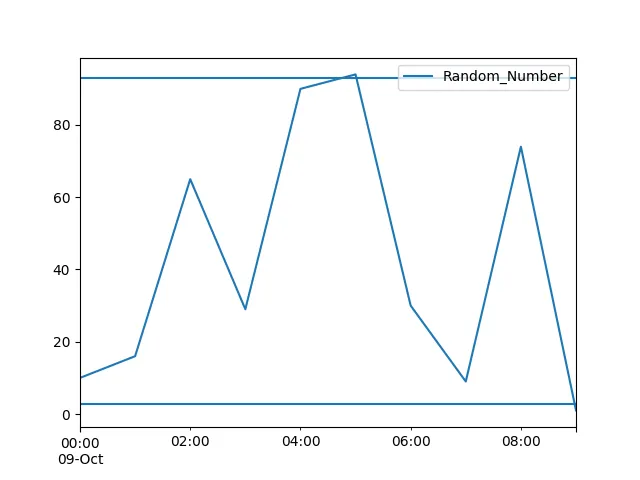
enter image description here

我可以打印出df上下百分位的值: df.quantile(0.025) df.quantile(0.975)

但是如何在我的图表中添加线条以表示数据集的第2.5百分位数和第97.5百分位数呢?
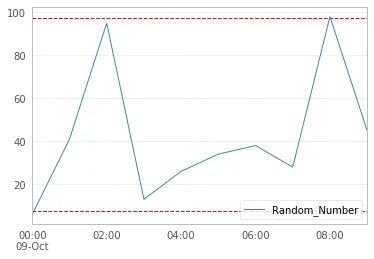

你看看 ax.hline - Quang Hoang
2个回答

1
使用plt.axhline绘制特定Y值处的水平线(相应地,有plt.axvline用于在特定X值处绘制垂直线):
import pandas as pd 
import numpy as np 
from numpy.random import randint 
import matplotlib.pyplot as plt                                                                                                                                                       

np.random.seed(10)  # added for reproductibility                                                                                                                                                                 

rng = pd.date_range('10/9/2018 00:00', periods=10, freq='1H') 
df = pd.DataFrame({'Random_Number':randint(1, 100, 10)}, index=rng)                                                                                                                   
df.plot()    

plt.axhline(df.quantile(0.025)[0])                                                                                                                                                    
plt.axhline(df.quantile(0.975)[0])                                                                                                                                                    

plt.show()

生成的图表:

enter image description here


1

你可以做:

import pandas as pd
import numpy as np
from numpy.random import randint
import matplotlib.pyplot as plt

rng = pd.date_range('10/9/2018 00:00', periods=10, freq='1H')
df = pd.DataFrame({'Random_Number':randint(1, 100, 10)}, index=rng)

df.plot()
plt.hlines(df.quantile(0.025), xmin=min(rng), xmax=max(rng), linestyle="--", color="r")
plt.hlines(df.quantile(0.975), xmin=min(rng), xmax=max(rng), linestyle="--", color="r");

enter image description here


网页内容由stack overflow 提供, 点击上面的
可以查看英文原文,
原文链接