我写了一个功能来逆向工程 StatSmooth 的 setup_params 函数中使用的步骤,以获取用于绘制的实际方法/公式参数。
该函数期望一个ggplot对象作为其输入,以及一个额外的可选参数,指定对应于 geom_smooth 的层(如果未指定,则默认为1)。它返回一个文本字符串,格式为"Method: [method used], Formula: [formula used]",并将所有参数打印到控制台上。
设想的用例是双重的:
- 将文本字符串原样添加到图表中作为图表标题/副标题/说明,以便在分析过程中快速参考;
- 从控制台输出中读取信息,并在图表中进行注释,手动格式化得体(例如解析的plotmath表达式),用于报告/演示。
功能:
get.params <- function(plot, layer = 1){
if(!"StatSmooth" %in% class(plot$layers[[layer]]$stat)){
message("No smoothing function was used in this geom layer.")
return("")
}
layer.data <- plot$layers[[layer]]$layer_data(plot$data)
layout <- ggplot2:::create_layout(plot$facet, plot$coordinates)
data <- layout$setup(list(layer.data), plot$data, plot$plot_env)
data[[1]] <- plot$layers[[layer]]$compute_aesthetics(data[[1]], plot)
scales <- plot$scales
data[[1]] <- ggplot2:::scales_transform_df(scales = scales, df = data[[1]])
layout$train_position(data, scales$get_scales("x"), scales$get_scales("y"))
data <- layout$map_position(data)[[1]]
stat.params <- suppressMessages(
plot$layers[[layer]]$stat$setup_params(data = data,
params = plot$layers[[layer]]$stat_params)
)
if(identical(stat.params$method, mgcv::gam)) stat.params$method <- "gam"
print(stat.params)
return(paste0("Method: ", stat.params$method, ", Formula: ", deparse(stat.params$formula)))
}
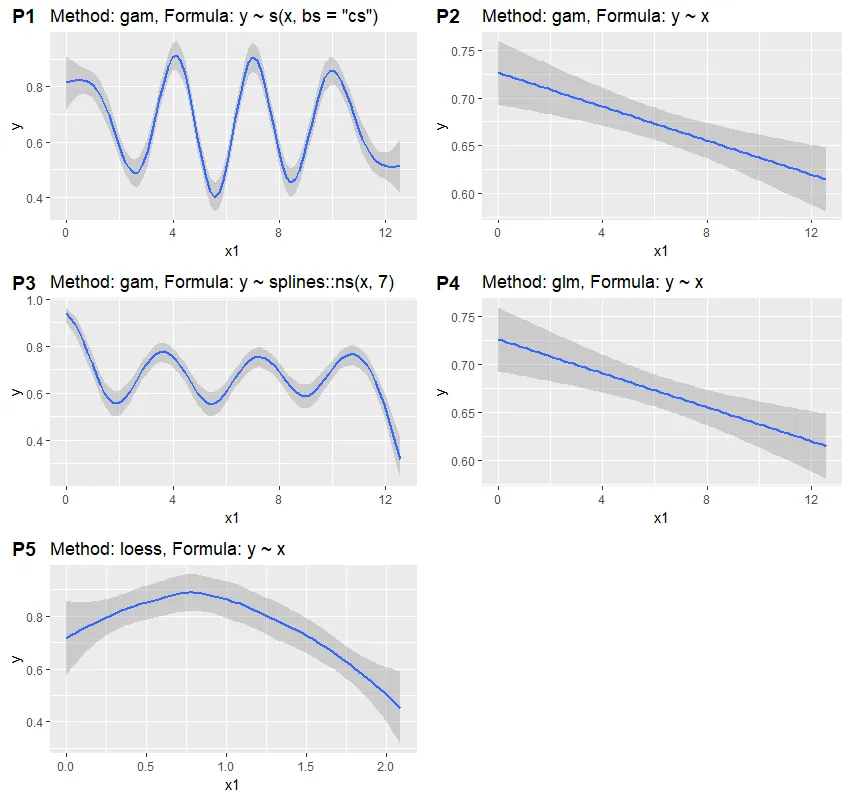
演示:
p <- ggplot(df, aes(x = x1, y = y))
p1 <- p + geom_smooth()
p1 + ggtitle(get.params(p1))
p2 <- p + geom_smooth(method='gam')
p2 + ggtitle(get.params(p2))
p3 <- p + geom_smooth(method='gam',
method.args = list(family = "binomial"),
formula = y ~ splines::ns(x, 7))
p3 + ggtitle(get.params(p3))
p4 <- p + geom_smooth(method='glm')
p4 + ggtitle(get.params(p4))
p5 <- p + geom_smooth(data = . %>% slice(1:500))
p5 + ggtitle(get.params(p5))
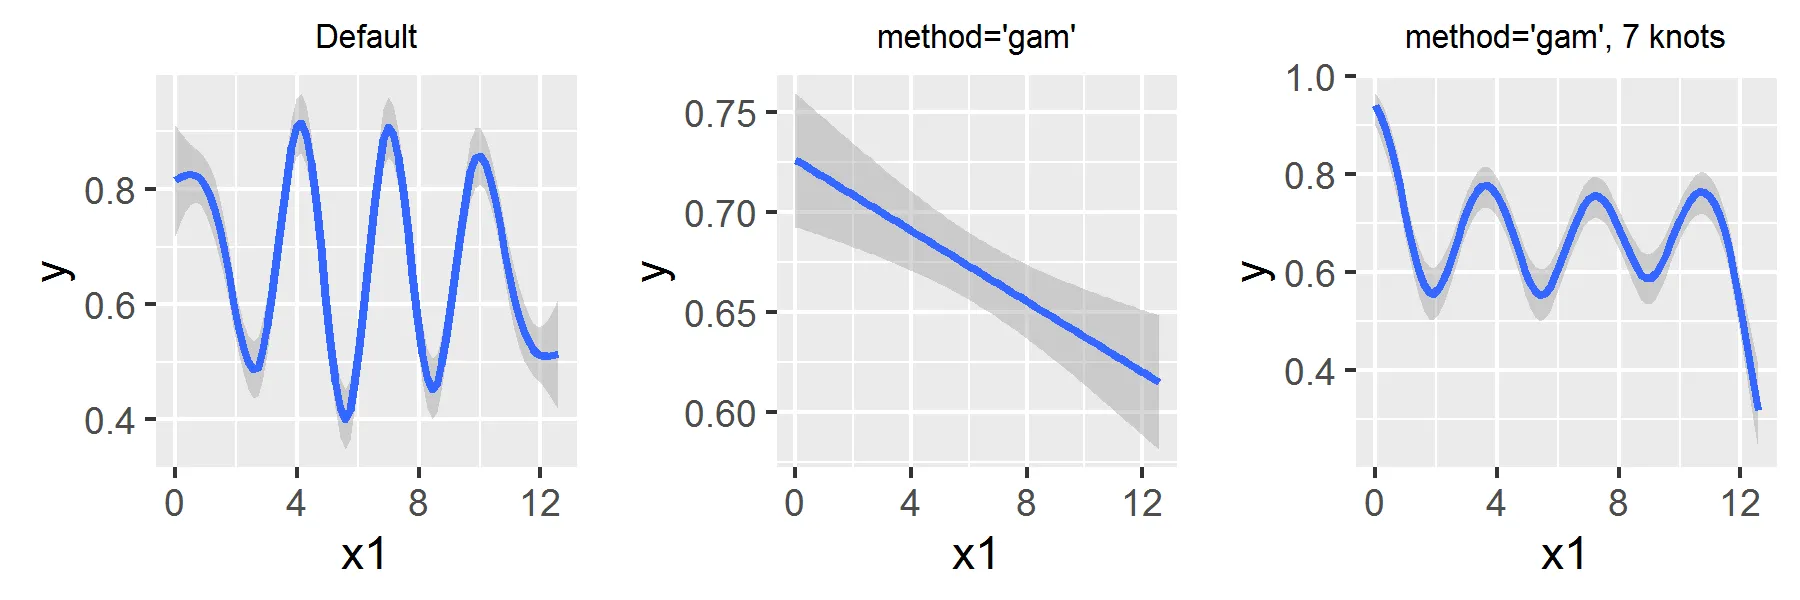
formula = y ~ s(x, bs = "cs"),因此k被设置为从mgcv::s中获取的默认值。然而,在ggplot2_2.2.0中,“gam”默认使用formula = y ~ x,因此拟合一条直线而不是任何类型的样条曲线。我对此表示怀疑;结果图现在与使用“lm”得到的相同。 - aosmith,则默认公式不会从y〜x更改为y〜s(x,bs =“cs”)`,这种行为是正确的;我们报告公式但不自动更改它。这取决于你。” - Z.Lin