我将尝试使用下面的代码使用ggplot2绘制线性判别图:
这段代码给出了如下的LDA图形,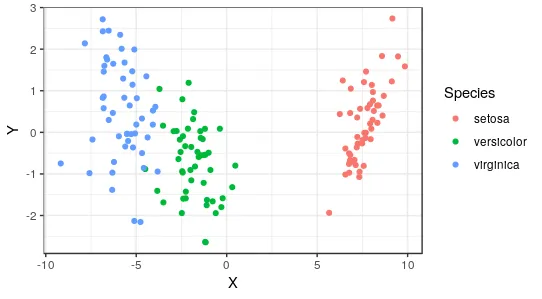 但我想为三个种群改变颜色,因此我修改了上面的代码,如下所示,
但是这段代码会报错美学必须是长度为1或与数据相同(150): x、y、colour。有没有办法可以解决这个问题?
require(MASS)
require(ggplot2)
data("iris")
my.data <- iris
model <- lda(formula = Species ~ ., data = my.data)
data.lda.values <- predict(model)
plot.data <- data.frame(X=data.lda.values$x[,1], Y=data.lda.values$x[,2], Species=my.data$Species)
p <- ggplot(data=plot.data, aes(x=X, y=Y)) +
geom_point(aes(color=Species)) +
theme_bw()
p
这段代码给出了如下的LDA图形,
但我想为三个种群改变颜色,因此我修改了上面的代码,如下所示,my_colors <- c("yellow","magenta","cyan")
p <- ggplot(data=plot.data, aes(x=X, y=Y,color=my_colors)) +
geom_point() +
scale_fill_manual(values=my_colors)
p
但是这段代码会报错美学必须是长度为1或与数据相同(150): x、y、colour。有没有办法可以解决这个问题?

