我有一张图片,想要检测其中的文本区域。
我尝试过 TiRG_RAW_20110219 项目,但结果并不令人满意。如果输入图片是 http://imgur.com/yCxOvQS,GD38rCa,则会产生http://imgur.com/yCxOvQS,GD38rCa#1 作为输出。
有人能提供一些替代方案吗?我希望通过仅将文本区域作为输入发送给 Tesseract,从而改善其输出。
我有一张图片,想要检测其中的文本区域。
我尝试过 TiRG_RAW_20110219 项目,但结果并不令人满意。如果输入图片是 http://imgur.com/yCxOvQS,GD38rCa,则会产生http://imgur.com/yCxOvQS,GD38rCa#1 作为输出。
有人能提供一些替代方案吗?我希望通过仅将文本区域作为输入发送给 Tesseract,从而改善其输出。
import cv2
def captch_ex(file_name):
img = cv2.imread(file_name)
img_final = cv2.imread(file_name)
img2gray = cv2.cvtColor(img, cv2.COLOR_BGR2GRAY)
ret, mask = cv2.threshold(img2gray, 180, 255, cv2.THRESH_BINARY)
image_final = cv2.bitwise_and(img2gray, img2gray, mask=mask)
ret, new_img = cv2.threshold(image_final, 180, 255, cv2.THRESH_BINARY) # for black text , cv.THRESH_BINARY_INV
'''
line 8 to 12 : Remove noisy portion
'''
kernel = cv2.getStructuringElement(cv2.MORPH_CROSS, (3,
3)) # to manipulate the orientation of dilution , large x means horizonatally dilating more, large y means vertically dilating more
dilated = cv2.dilate(new_img, kernel, iterations=9) # dilate , more the iteration more the dilation
contours, hierarchy = cv2.findContours(dilated, cv2.RETR_EXTERNAL, cv2.CHAIN_APPROX_NONE) # findContours returns 3 variables for getting contours
for contour in contours:
# get rectangle bounding contour
[x, y, w, h] = cv2.boundingRect(contour)
# Don't plot small false positives that aren't text
if w < 35 and h < 35:
continue
# draw rectangle around contour on original image
cv2.rectangle(img, (x, y), (x + w, y + h), (255, 0, 255), 2)
'''
#you can crop image and send to OCR , false detected will return no text :)
cropped = img_final[y :y + h , x : x + w]
s = file_name + '/crop_' + str(index) + '.jpg'
cv2.imwrite(s , cropped)
index = index + 1
'''
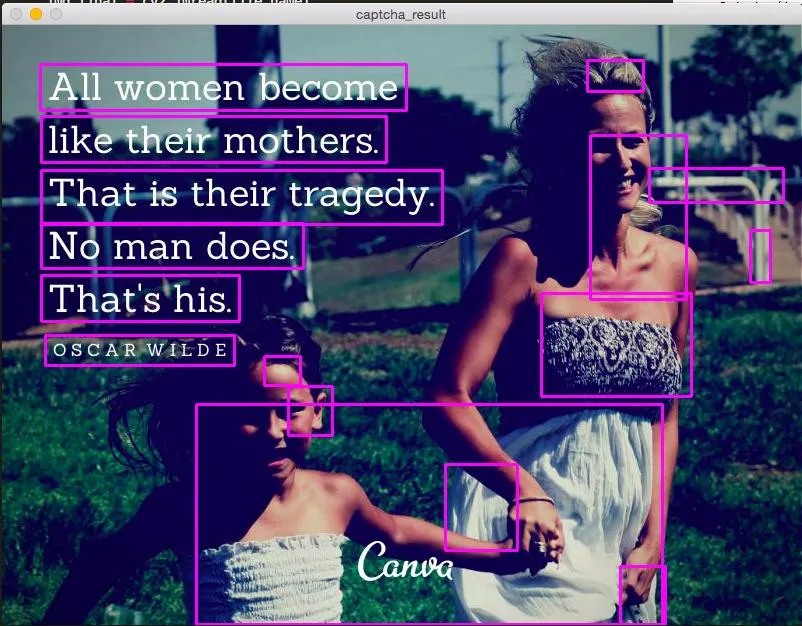
# write original image with added contours to disk
cv2.imshow('captcha_result', img)
cv2.waitKey()
file_name = 'your_image.jpg'
captch_ex(file_name)
contours,hierarchy = cv2.findContours(dilated,cv2.RETR_EXTERNAL,cv2.CHAIN_APPROX_NONE)。有关更多详细信息,请参见此处:要查找轮廓-> ValueError:没有足够的值来解包(期望3个,得到2个),这会出现。 - Racing由于没有人发布完整的解决方案,以下是一种方法。观察到所需文本为白色,并且单词结构呈水平对齐状态,我们可以使用颜色分割来提取并进行光学字符识别。
执行颜色分割。 我们加载图像,将其转换为HSV格式,定义下限/上限范围,并使用 cv2.inRange() 执行颜色分割以获取二进制掩码。
膨胀以连接文本字符。 我们使用 cv2.getStructuringElement() 创建一个水平形状的核,然后使用 cv2.dilate() 进行膨胀,将单个字母组合成单个轮廓。
删除非文本轮廓。 我们使用 cv2.findContours() 查找轮廓,并使用 宽高比 进行过滤,以删除非文本字符。由于文本是水平方向的,如果确定轮廓小于预定义的宽高比阈值,则使用 cv2.drawContours() 填充轮廓以删除非文本轮廓。
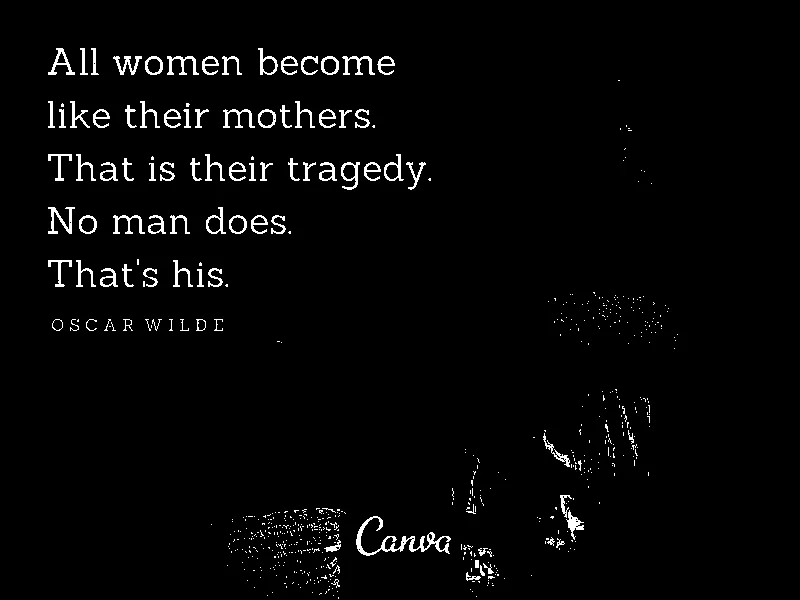
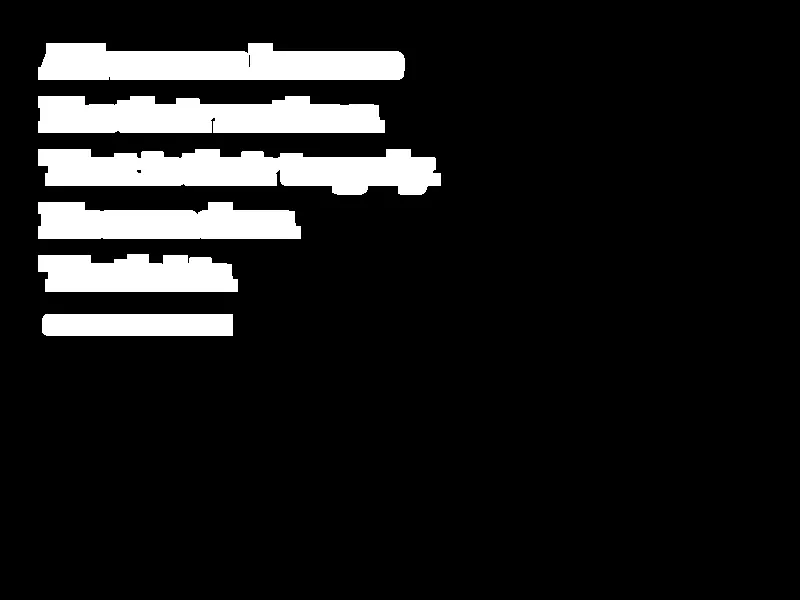
执行OCR。 我们对膨胀的图像和初始掩码进行按位与操作,以仅隔离文本字符并反转图像,使文本为黑色,背景为白色。最后,我们将图像输入到Pytesseract OCR中。
以下是每个步骤的可视化展示:
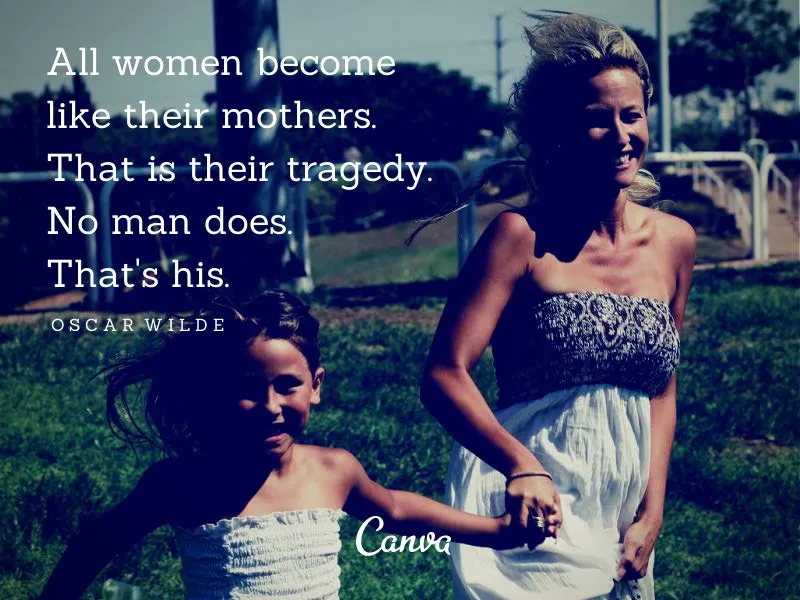
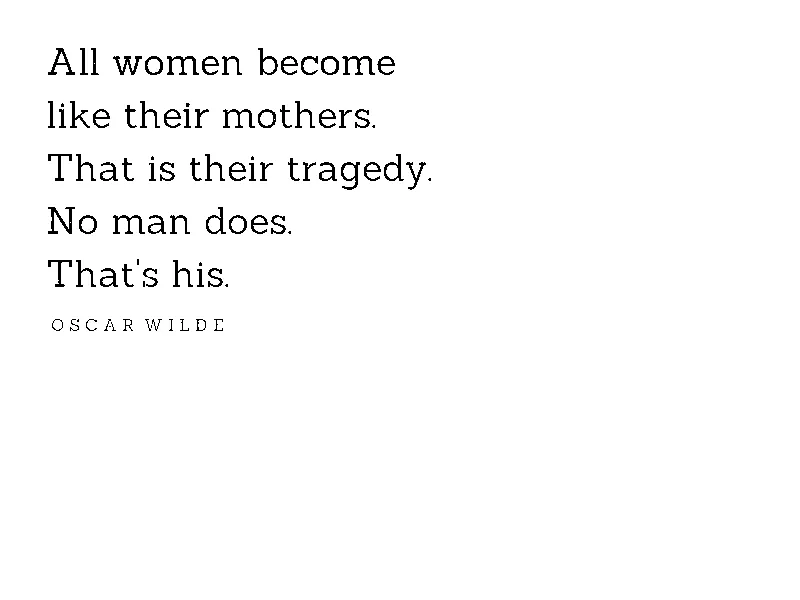
输入图像
从颜色分割生成的掩码
# Load image, convert to HSV format, define lower/upper ranges, and perform
# color segmentation to create a binary mask
image = cv2.imread('1.jpg')
hsv = cv2.cvtColor(image, cv2.COLOR_BGR2HSV)
lower = np.array([0, 0, 218])
upper = np.array([157, 54, 255])
mask = cv2.inRange(hsv, lower, upper)
通过宽高比过滤,将膨胀后的图像连接文本轮廓并删除非文本轮廓
# Create horizontal kernel and dilate to connect text characters
kernel = cv2.getStructuringElement(cv2.MORPH_RECT, (5,3))
dilate = cv2.dilate(mask, kernel, iterations=5)

# Find contours and filter using aspect ratio
# Remove non-text contours by filling in the contour
cnts = cv2.findContours(dilate, cv2.RETR_EXTERNAL, cv2.CHAIN_APPROX_SIMPLE)
cnts = cnts[0] if len(cnts) == 2 else cnts[1]
for c in cnts:
    x,y,w,h = cv2.boundingRect(c)
    ar = w / float(h)
    if ar < 5:
        cv2.drawContours(dilate, [c], -1, (0,0,0), -1)
使用按位与运算符同时对掩码和反转掩码进行操作,以便为OCR准备结果。
# Bitwise dilated image with mask, invert, then OCR
result = 255 - cv2.bitwise_and(dilate, mask)
data = pytesseract.image_to_string(result, lang='eng',config='--psm 6')
print(data)
使用--psm 6配置设置假定一个统一的文本块,从Pytesseract OCR得到的结果。查看此处获取更多配置选项。
All women become
like their mothers.
That is their tragedy.
No man does.

That's his.

OSCAR WILDE
完整代码
import cv2
import numpy as np
import pytesseract

pytesseract.pytesseract.tesseract_cmd = r"C:\Program Files\Tesseract-OCR\tesseract.exe"

# Load image, convert to HSV format, define lower/upper ranges, and perform
# color segmentation to create a binary mask
image = cv2.imread('1.jpg')
hsv = cv2.cvtColor(image, cv2.COLOR_BGR2HSV)
lower = np.array([0, 0, 218])
upper = np.array([157, 54, 255])
mask = cv2.inRange(hsv, lower, upper)

# Create horizontal kernel and dilate to connect text characters
kernel = cv2.getStructuringElement(cv2.MORPH_RECT, (5,3))
dilate = cv2.dilate(mask, kernel, iterations=5)

# Find contours and filter using aspect ratio
# Remove non-text contours by filling in the contour
cnts = cv2.findContours(dilate, cv2.RETR_EXTERNAL, cv2.CHAIN_APPROX_SIMPLE)
cnts = cnts[0] if len(cnts) == 2 else cnts[1]
for c in cnts:
    x,y,w,h = cv2.boundingRect(c)
    ar = w / float(h)
    if ar < 5:
        cv2.drawContours(dilate, [c], -1, (0,0,0), -1)

# Bitwise dilated image with mask, invert, then OCR
result = 255 - cv2.bitwise_and(dilate, mask)
data = pytesseract.image_to_string(result, lang='eng',config='--psm 6')
print(data)

cv2.imshow('mask', mask)
cv2.imshow('dilate', dilate)
cv2.imshow('result', result)
cv2.waitKey()
使用此HSV颜色阈值脚本确定了HSV下限/上限颜色范围。
import cv2
import numpy as np

def nothing(x):
    pass

# Load image
image = cv2.imread('1.jpg')

# Create a window
cv2.namedWindow('image')

# Create trackbars for color change
# Hue is from 0-179 for Opencv
cv2.createTrackbar('HMin', 'image', 0, 179, nothing)
cv2.createTrackbar('SMin', 'image', 0, 255, nothing)
cv2.createTrackbar('VMin', 'image', 0, 255, nothing)
cv2.createTrackbar('HMax', 'image', 0, 179, nothing)
cv2.createTrackbar('SMax', 'image', 0, 255, nothing)
cv2.createTrackbar('VMax', 'image', 0, 255, nothing)

# Set default value for Max HSV trackbars
cv2.setTrackbarPos('HMax', 'image', 179)
cv2.setTrackbarPos('SMax', 'image', 255)
cv2.setTrackbarPos('VMax', 'image', 255)

# Initialize HSV min/max values
hMin = sMin = vMin = hMax = sMax = vMax = 0
phMin = psMin = pvMin = phMax = psMax = pvMax = 0

while(1):
    # Get current positions of all trackbars
    hMin = cv2.getTrackbarPos('HMin', 'image')
    sMin = cv2.getTrackbarPos('SMin', 'image')
    vMin = cv2.getTrackbarPos('VMin', 'image')
    hMax = cv2.getTrackbarPos('HMax', 'image')
    sMax = cv2.getTrackbarPos('SMax', 'image')
    vMax = cv2.getTrackbarPos('VMax', 'image')

    # Set minimum and maximum HSV values to display
    lower = np.array([hMin, sMin, vMin])
    upper = np.array([hMax, sMax, vMax])

    # Convert to HSV format and color threshold
    hsv = cv2.cvtColor(image, cv2.COLOR_BGR2HSV)
    mask = cv2.inRange(hsv, lower, upper)
    result = cv2.bitwise_and(image, image, mask=mask)

    # Print if there is a change in HSV value
    if((phMin != hMin) | (psMin != sMin) | (pvMin != vMin) | (phMax != hMax) | (psMax != sMax) | (pvMax != vMax) ):
        print("(hMin = %d , sMin = %d, vMin = %d), (hMax = %d , sMax = %d, vMax = %d)" % (hMin , sMin , vMin, hMax, sMax , vMax))
        phMin = hMin
        psMin = sMin
        pvMin = vMin
        phMax = hMax
        psMax = sMax
        pvMax = vMax

    # Display result image
    cv2.imshow('image', result)
    if cv2.waitKey(10) & 0xFF == ord('q'):
        break

cv2.destroyAllWindows()
您可以使用基于深度学习的文本检测器Efficient and Accurate Scene Text - EAST。它可以与OpenCV函数一起使用,但首先需要从frozen_east_text_detection.pb下载训练好的模型。
以下代码及其注释完全借用自此处-text_detection.py。请记得将下载的.pb文件传递给cv2.dnn.readNet()。
亮点:
.pb 文件的形式传递给 cv2.dnn.readNet()。layerNames 中定义了两个输出层,分别用于文本包含概率和边界框坐标。cv2.dnn.blobFromImage() 转换成一个blob。这个过程包括均值减法、缩放和通道交换。更多细节请参考此处net.setInput()。如需更多代码解释,请参考此处
代码:
image = cv2.imread('path_to_image')
orig = image.copy()
(H, W) = image.shape[:2]

# set the new width and height and then determine the ratio in change
# for both the width and height
(newW, newH) = (320, 320)
rW = W / float(newW)
rH = H / float(newH)

# resize the image and grab the new image dimensions
image = cv2.resize(image, (newW, newH))
(H, W) = image.shape[:2]

# define the two output layer names for the EAST detector model that
# we are interested -- the first is the output probabilities and the
# second can be used to derive the bounding box coordinates of text
layerNames = [
    "feature_fusion/Conv_7/Sigmoid",
    "feature_fusion/concat_3"]

# load the pre-trained EAST text detector
print("[INFO] loading EAST text detector...")
net = cv2.dnn.readNet('path_containing_frozen_east_text_detection.pb')

# construct a blob from the image and then perform a forward pass of
# the model to obtain the two output layer sets
blob = cv2.dnn.blobFromImage(image, 1.0, (W, H),(123.68, 116.78, 103.94), swapRB=True, crop=False)
net.setInput(blob)
(scores, geometry) = net.forward(layerNames)

# grab the number of rows and columns from the scores volume, then
# initialize our set of bounding box rectangles and corresponding
# confidence scores
(numRows, numCols) = scores.shape[2:4]
rects = []
confidences = []

# loop over the number of rows
for y in range(0, numRows):
    # extract the scores (probabilities), followed by the geometrical
    # data used to derive potential bounding box coordinates that
    # surround text
    scoresData = scores[0, 0, y]
    xData0 = geometry[0, 0, y]
    xData1 = geometry[0, 1, y]
    xData2 = geometry[0, 2, y]
    xData3 = geometry[0, 3, y]
    anglesData = geometry[0, 4, y]

    for x in range(0, numCols):
        # ignore probability values below 0.75
        if scoresData[x] < 0.75:
            continue

        # compute the offset factor as our resulting feature maps will
        # be 4x smaller than the input image
        (offsetX, offsetY) = (x * 4.0, y * 4.0)

        # extract the rotation angle for the prediction and then
        # compute the sin and cosine
        angle = anglesData[x]
        cos = np.cos(angle)
        sin = np.sin(angle)

        # use the geometry volume to derive the width and height of
        # the bounding box
        h = xData0[x] + xData2[x]
        w = xData1[x] + xData3[x]

        # compute both the starting and ending (x, y)-coordinates for
        # the text prediction bounding box
        endX = int(offsetX + (cos * xData1[x]) + (sin * xData2[x]))
        endY = int(offsetY - (sin * xData1[x]) + (cos * xData2[x]))
        startX = int(endX - w)
        startY = int(endY - h)

        # add the bounding box coordinates and probability score to
        # our respective lists
        rects.append((startX, startY, endX, endY))
        confidences.append(scoresData[x])

# apply non-maxima suppression to suppress weak, overlapping bounding
# boxes
boxes = non_max_suppression(np.array(rects), probs=confidences)

# loop over the bounding boxes
for (startX, startY, endX, endY) in boxes:
    # scale the bounding box coordinates based on the respective
    # ratios
    startX = int(startX * rW)
    startY = int(startY * rH)
    endX = int(endX * rW)
    endY = int(endY * rH)
    # draw the bounding box on the image
    cv2.rectangle(orig, (startX, startY), (endX, endY), (0, 255, 0), 2)

cv2.imwrite('path_to_save', orig)
结果:
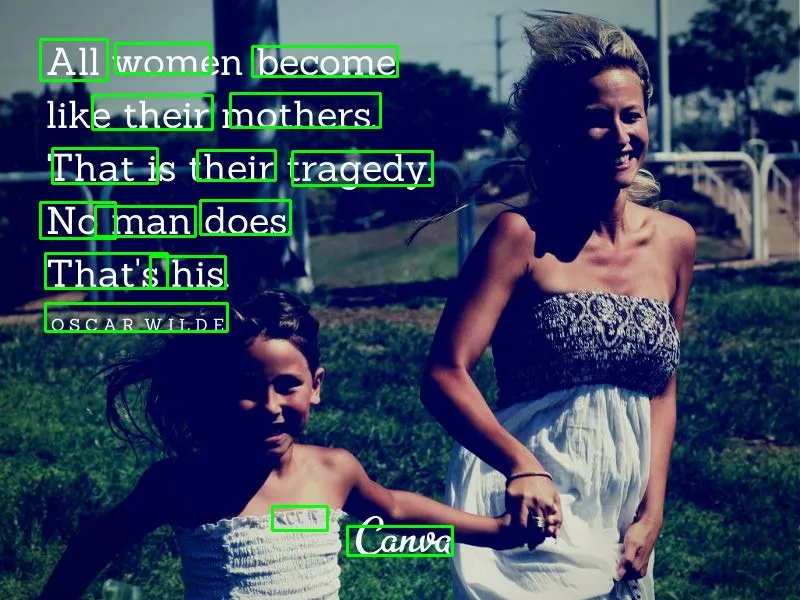
虽然结果不如预期,但相当接近
更新:
要裁剪并保存每个单独的边界框作为图像,请执行以下操作:
# take a copy o the original image
image2 = orig.copy()
for i, (startX, startY, endX, endY) in enumerate(boxes):
    startX = int(startX * rW)
    startY = int(startY * rH)
    endX = int(endX * rW)
    endY = int(endY * rH)
    cropped = image2[startY:endY, startX:endX]
    cv2.imwrite(r'Cropped_result\crop_img_{}.jpg'.format(i), cropped)
non_max_suppression函数以便更好地理解。 - Sabarish Rnon_max_suppression() 取自 imutils 包,来源于 https://github.com/PyImageSearch/imutils/blob/master/imutils/object_detection.py#L4 - Jeru Luke