我想知道是否有可能在ggplot2图表的标题中访问提供的数据的列。类似这样:
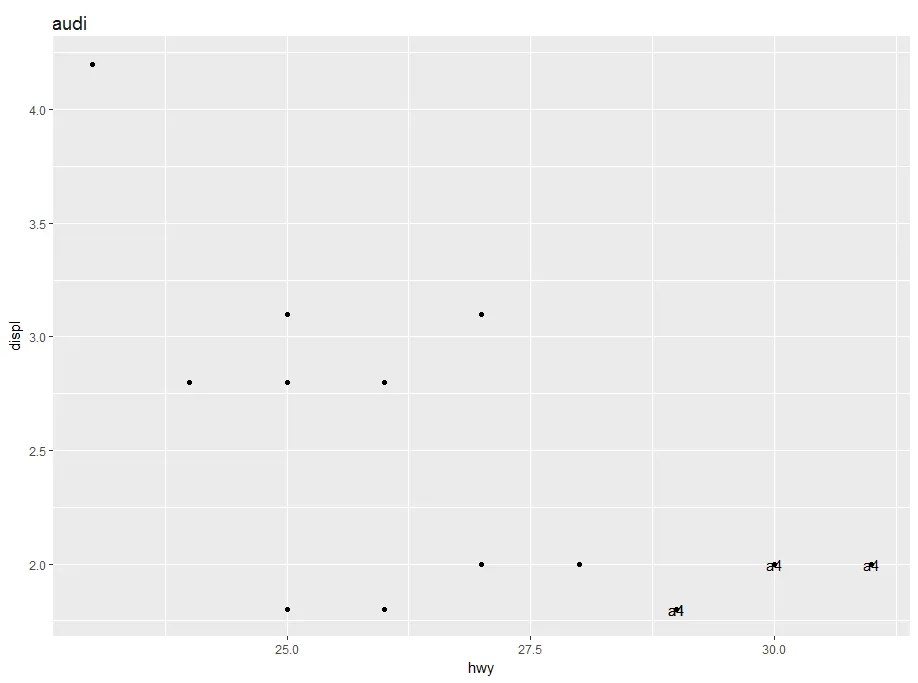
ggplot(mpg %>% filter(manufacturer == 'audi'),
  aes(x = hwy, y = displ, label = model)) +
    geom_point() +
    geom_text(data = . %>% filter(hwy > 28)) +
    ggtitle(unique(.$manufacurer))
我经常像上面的示例一样创建绘图来仅绘制子集,并希望能自动标记子集。目前,
. 在 ggtitle 中将不被识别,但在 geom-text 中却可以工作。
编辑:
由于我从 @Brian 获得了一个非常好的评论和重复标记,那么在 dplyr::group_by 函数中是否有使用这个 {} 技巧的解决方案?这在某种程度上是无法正常工作的。我想为每个组创建单独的图形,但似乎只有完整的数据框进入了 ggplot 调用。mpg %>%
group_by(manufacturer) %>% {
ggplot(., aes(cyl, displ, color=manufacturer)) +
geom_point() +
ggtitle(unique(.$manufacturer))
}
它显示的是奥迪,但在同一个图表中打印了所有制造商。


p <- ggplot(...) + geom_text(...); 然后提取数据,如p + ggtitle(unique(p$data$manufacturer))。 - akrunggplot(mpg %>% filter(manufacturer == 'audi'), aes(x = hwy, y = displ, label = model, title=quo_name(unique(manufacturer)))) + geom_point() + geom_text(data = . %>% filter(hwy > 28))- Roman