评论中的更新。
有几种方法可以做到这一点:像Axeman建议的那样使用facet_创建一个在图表上方的条带(更容易改变条带的格式而不是标题条带),或者您可以手动创建一个标题条带,然后将其粘贴到图表上。
示例
library(ggplot2)
library(gridExtra)
library(grid)
mtcars$tempvar <- "Market Updates"
p <- ggplot(mtcars, aes(mpg, wt)) +
geom_line(aes(colour="Com")) +
scale_colour_manual(name="", values=c(Com = "#228b22") ) +
labs(x = "Date", y = "High")
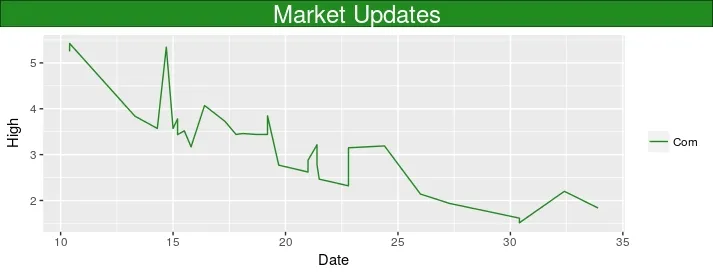
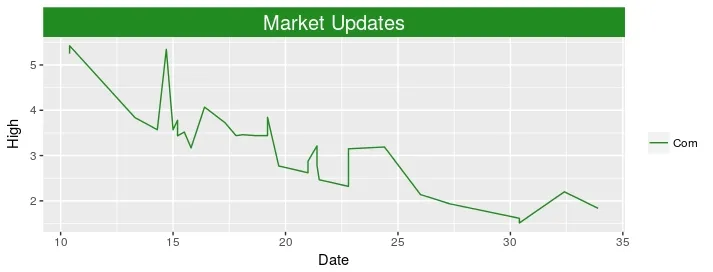
通过使用facet_:这只会在绘图面板上添加颜色条,尽管标题居中。
p + facet_grid(. ~ tempvar) +
        theme(strip.background = element_rect(fill="#228b22"),
              strip.text = element_text(size=15, colour="white"))
哪种方式会产生以下效果
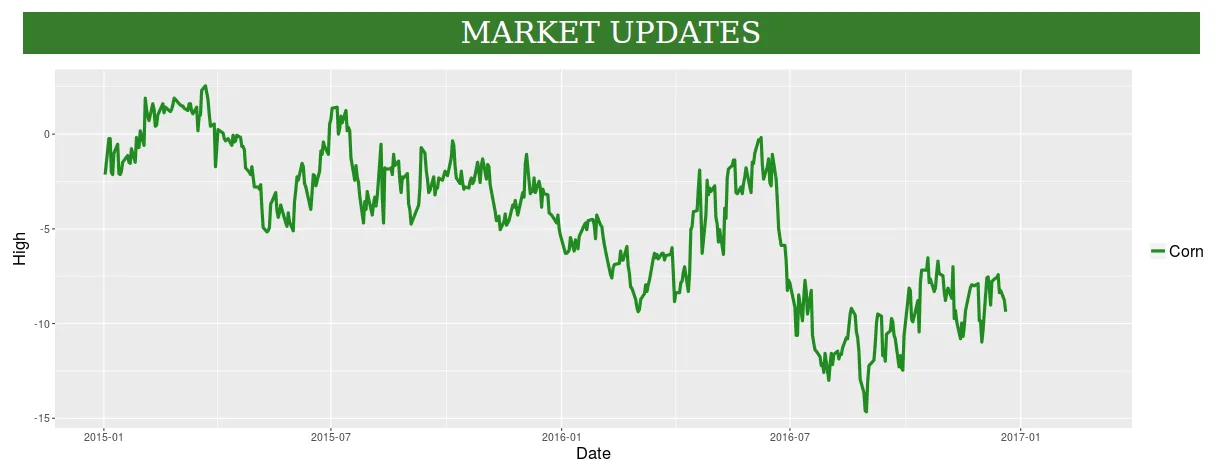
使用 grid 函数:这将在绘图面板上添加颜色条,但标题位于图形窗口的中心。(您可以通过将其添加到绘图 gtable 来获得更多的位置控制)
my_g <- grobTree(rectGrob(gp=gpar(fill="#228b22")),
                 textGrob("Market Updates", x=0.5, hjust=0.5,
                                            gp=gpar(col="white", cex=1.5)))

grid.arrange(my_g, p, heights=c(1,9))
哪一个产生