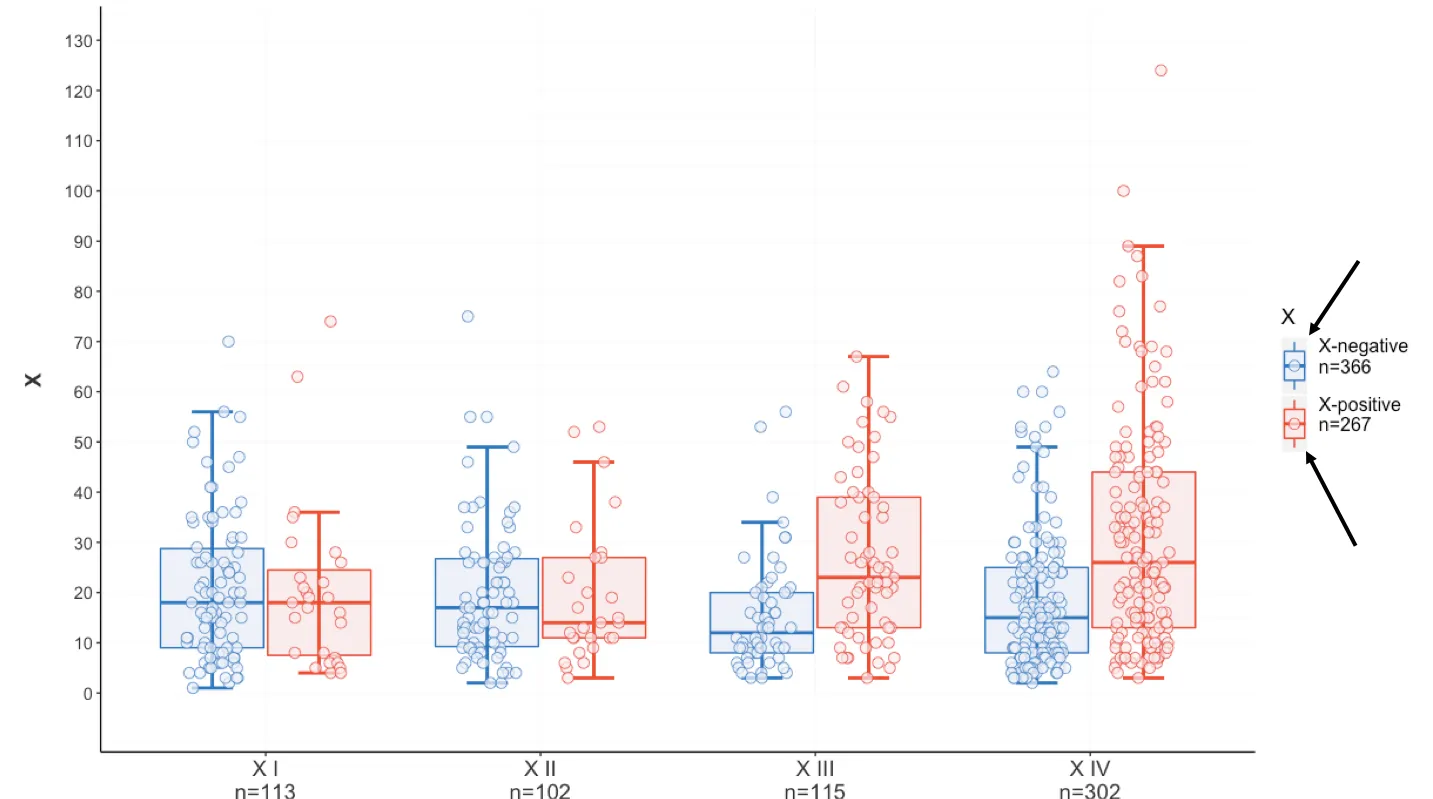
我有以下的图表:
您可能可以在图片上看到,右侧标有黑色箭头的灰色背景,其中列出了X-negative和X-positive (您可以加载数据和脚本以自行查看,请参见下文)。
我想要将特定的灰色背景改为白色背景。如何更改呢?
我使用了以下自定义的设计。请查看下方标示为 w1 和 w2 的数据样本。
# Custom designed theme
theme <- theme(axis.line = element_line(colour = "black"),
               panel.grid.major = element_line(colour = "gray98"),
               panel.grid.minor = element_line(colour = "gray98"),
               panel.border = element_blank(),
               panel.background = element_blank())
与
# My script
df <- data.frame(x = as.factor(c(w1$ny_stadie, w2$ny_stadie)),
                 y = c(w1$n.fjernet, w2$n.fjernet),
                 f = rep(c("N+", "N0"), c(nrow(w1), nrow(w2))))
df <- df[!is.na(df$x),]

ggplot(df) +
  geom_boxplot(aes(x, y, fill = f, colour = f), outlier.alpha = 0, position = position_dodge(width = 0.78)) +
  scale_x_discrete(name = "", label=c("X I\nn=113","X II\nn=102","X III\nn=115","X IV\nn=302")) + theme +
  scale_y_continuous(name="X", breaks=seq(0,130,10), limits=c(-5,130)) +
  stat_boxplot(aes(x, y, colour = f), geom = "errorbar", width = 0.3,position = position_dodge(0.7753), size=1) +
  geom_point(aes(x, y, fill = f, colour = f), size = 3, shape = 21, position = position_jitterdodge(), alpha=0.7) +
  scale_fill_manual(values = c("#edf1f9", "#fcebeb"), name = "X",
                    labels = c("\nX\nn=366\n ", "\nX\nn=267\n ")) +
  scale_colour_manual(values = c("#1C73C2", "red"), name = "X",
                      labels = c("\nX\nn=366\n ", "\nX\nn=267\n ")) +


  theme(axis.text.x = element_text(color = "grey20", size = 14), axis.title.x = element_text(color = "grey20", size = 14, face="bold", margin=margin(t=12))) +
  theme(axis.text.y = element_text(color = "grey20", size = 11), axis.title.y = element_text(color = "grey20", size = 14, face="bold", margin=margin(r=12))) +
  theme(legend.text=element_text(size=12)) + theme(legend.title=element_text(size=14))
数据样本
w1 <- structure(list(ny_stadie = structure(c(1, 1, 4, 4, 1, 3, 1, 4,
                                             3, 2, 2, 3, 4, 4, 4, 2, 4, 4, 3, 4, 2, 4, 4, 4, 4, 1, 4, 4, 4,
                                             2, 1, 2, 2, 3, 1, 4, 3, 1, 3, 1, 4, 4, 2, 1, 4, 1, 4, 2, 4, 2
), class = "AsIs"), n.fjernet = c(25L, 3L, 27L, 22L, 18L, 9L,
                                  6L, 5L, 25L, 13L, 5L, 56L, 56L, 30L, 27L, 27L, 26L, 24L, 22L,
                                  22L, 20L, 19L, 18L, 17L, 15L, 15L, 13L, 12L, 12L, 11L, 11L, 10L,
                                  9L, 8L, 8L, 8L, 8L, 7L, 7L, 6L, 5L, 4L, 2L, 2L, 2L, 34L, 30L,
                                  28L, 25L, 22L)), row.names = c(1L, 3L, 4L, 33L, 41L, 65L, 74L,
                                                                 81L, 82L, 84L, 86L, 88L, 89L, 97L, 100L, 101L, 102L, 104L, 107L,
                                                                 108L, 112L, 114L, 116L, 117L, 119L, 120L, 126L, 128L, 129L, 135L,
                                                                 136L, 137L, 143L, 144L, 145L, 147L, 148L, 150L, 154L, 157L, 160L,
                                                                 162L, 167L, 168L, 169L, 170L, 171L, 172L, 173L, 174L), class = "data.frame")
与
w2 <- structure(list(ny_stadie = structure(c(4, 3, 4, 4, 4, 4, 4, 4,
                                             3, 1, 3, 4, 3, 1, 1, 1, 4, 4, 3, 4, 4, 2, 2, 2, 2, 4, 3, 2, 1,
                                             1, 4, 3, 2, 1, 1, 1, 4, 3, 4, 2, 4, 4, 4, 4, 3, 4, 2, 2, 4, 4
), class = "AsIs"), n.fjernet = c(10L, 13L, 9L, 7L, 7L, 7L, 6L,
                                  6L, 5L, 4L, 3L, 37L, 26L, 19L, 17L, 15L, 9L, 57L, 55L, 33L, 33L,
                                  33L, 28L, 27L, 27L, 26L, 23L, 23L, 23L, 22L, 21L, 21L, 20L, 20L,
                                  19L, 18L, 18L, 18L, 17L, 17L, 16L, 16L, 16L, 15L, 15L, 15L, 14L,
                                  14L, 13L, 13L)), row.names = c(2L, 5L, 6L, 7L, 8L, 9L, 10L, 11L,
                                                                 12L, 13L, 14L, 15L, 16L, 17L, 18L, 19L, 20L, 21L, 22L, 23L, 24L,
                                                                 25L, 26L, 27L, 28L, 29L, 30L, 31L, 32L, 34L, 35L, 36L, 37L, 38L,
                                                                 39L, 40L, 42L, 43L, 44L, 45L, 46L, 47L, 48L, 49L, 50L, 51L, 52L,
                                                                 53L, 54L, 55L), class = "data.frame")
