我想像
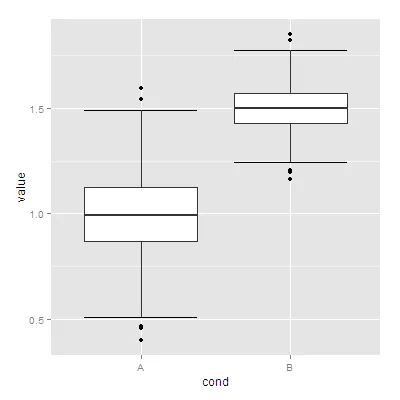
boxplot函数一样自动在须的两端放置垂直直线。正如@Roland所暗示但未实现的那样,您可以使用stat_boxplot来实现这一点。关键是调用_boxplot两次,并将一个调用的geom设置为errorbar。
请注意,由于R使用笔和纸的方法,建议先实现误差棒,然后在上面绘制传统的箱线图。
使用@Roland的虚拟数据df
ggplot(df, aes(x=cond, y = value))  +
 stat_boxplot(geom ='errorbar') +
 geom_boxplot() # shorthand for  stat_boxplot(geom='boxplot')
stat_boxplot 的帮助文档(?stat_boxplot)详细说明了计算并保存在data.frame中的各种值。
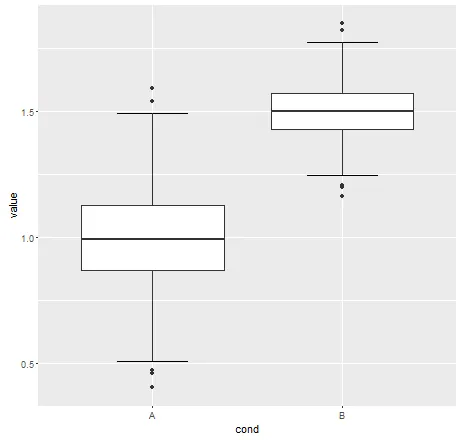
geom_boxplot(width=.2),我该如何调整这些须线的大小? - Produnisstat_boxplot中添加参数stat_params = list(width = 0.5)。请查看我回答中的结果。 - mpalancogeom_boxplot(width = 0.2) + stat_boxplot(geom = "errorbar", width = 0.2), 其中在箱线图和误差条中选择的值必须匹配。对于跨越半个箱子的须,您需要设置 width = 0.2 和 width = 0.1。 - PatrickT为了调整须线的大小,我们可以在函数stat_boxplot中使用参数width = 0.5。
set.seed(42)
df <- data.frame(cond = factor(rep(c("A", "B"), each = 500)),
                 value = c(rnorm(500, mean = 1, sd = 0.2),
                           rnorm(500, mean = 1.5, sd = 0.1)))

library(ggplot2)
ggplot(df, aes(x = cond, y = value)) +
       stat_boxplot(geom = "errorbar", width = 0.5) +
       geom_boxplot()
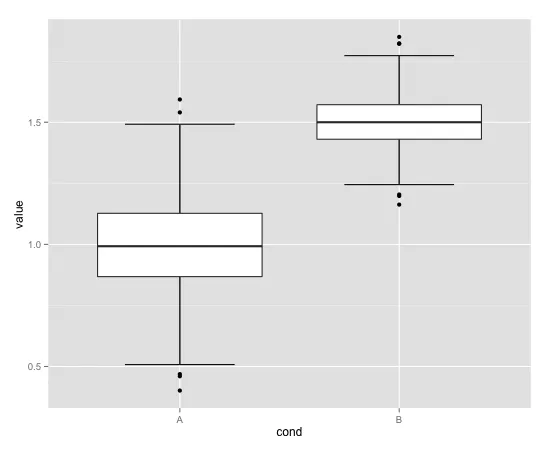
stat_params参数。现在应该可以正常工作了。 - mpalancostat_boxplot(geom='errorbar') + geom_boxplot(inherit.aes=TRUE)。 - Fábio也许可以使用 stat_boxplot 来计算箱线图的须端,但我不是一个足够熟练的 ggplot2 专家,因此我使用了基本函数。
set.seed(42)
df <- data.frame(cond = factor( rep(c("A","B"), each=500) ),
                 value = c(rnorm(500,mean=1,sd=0.2),rnorm(500, mean=1.5,sd=0.1)))


whisk <- function(df,cond_col=1,val_col=2) {
  require(reshape2)
  condname <- names(df)[cond_col]
  names(df)[cond_col] <- "cond"
  names(df)[val_col] <- "value"
  b <- boxplot(value~cond,data=df,plot=FALSE)
  df2 <- cbind(as.data.frame(b$stats),c("min","lq","m","uq","max"))
  names(df2) <- c(levels(df$cond),"pos")
  df2 <- melt(df2,id="pos",variable.name="cond")
  df2 <- dcast(df2,cond~pos)
  names(df2)[1] <- condname
  df2
}


library(ggplot2)

plot1 <- ggplot(df, aes(x=cond))
plot1 <- plot1 + geom_errorbar(aes(ymin=min,ymax=max),data=whisk(df),width = 0.5)
plot1 <- plot1 + geom_boxplot(aes(y=value))
plot1
geom_segment或geom_crossbar来在ggplot中绘制线条。参见此问题。 - Justinboxplot,因为后者已经实现了你想要的功能。或者这只是纯学术性的问题? - Jake Westfall