在寻找解决方案和尝试之后,我正在寻求帮助,尝试在箱线图上显示加权平均值(我也尝试将此发布到ggplot2邮件列表)。
以下是一个玩具示例。
#data
value <- c(5, 7, 8, 6, 7, 9, 10, 6, 7, 10)
category <- c("one", "one", "one", "two", "two", "two",
"three", "three", "three","three")
weight <- c(1, 1.2, 2, 3, 2.2, 2.5, 1.8, 1.9, 2.2, 1.5)
df <- data.frame(value, category, weight)
#unweighted means by category
ddply(df, .(category), summarize, mean=round(mean(value, na.rm=TRUE), 2))
category mean
1 one 6.67
2 three 8.25
3 two 7.33
#weighted means by category
ddply(df, .(category), summarize,
wmean=round(wtd.mean(value, weight, na.rm=TRUE), 2))
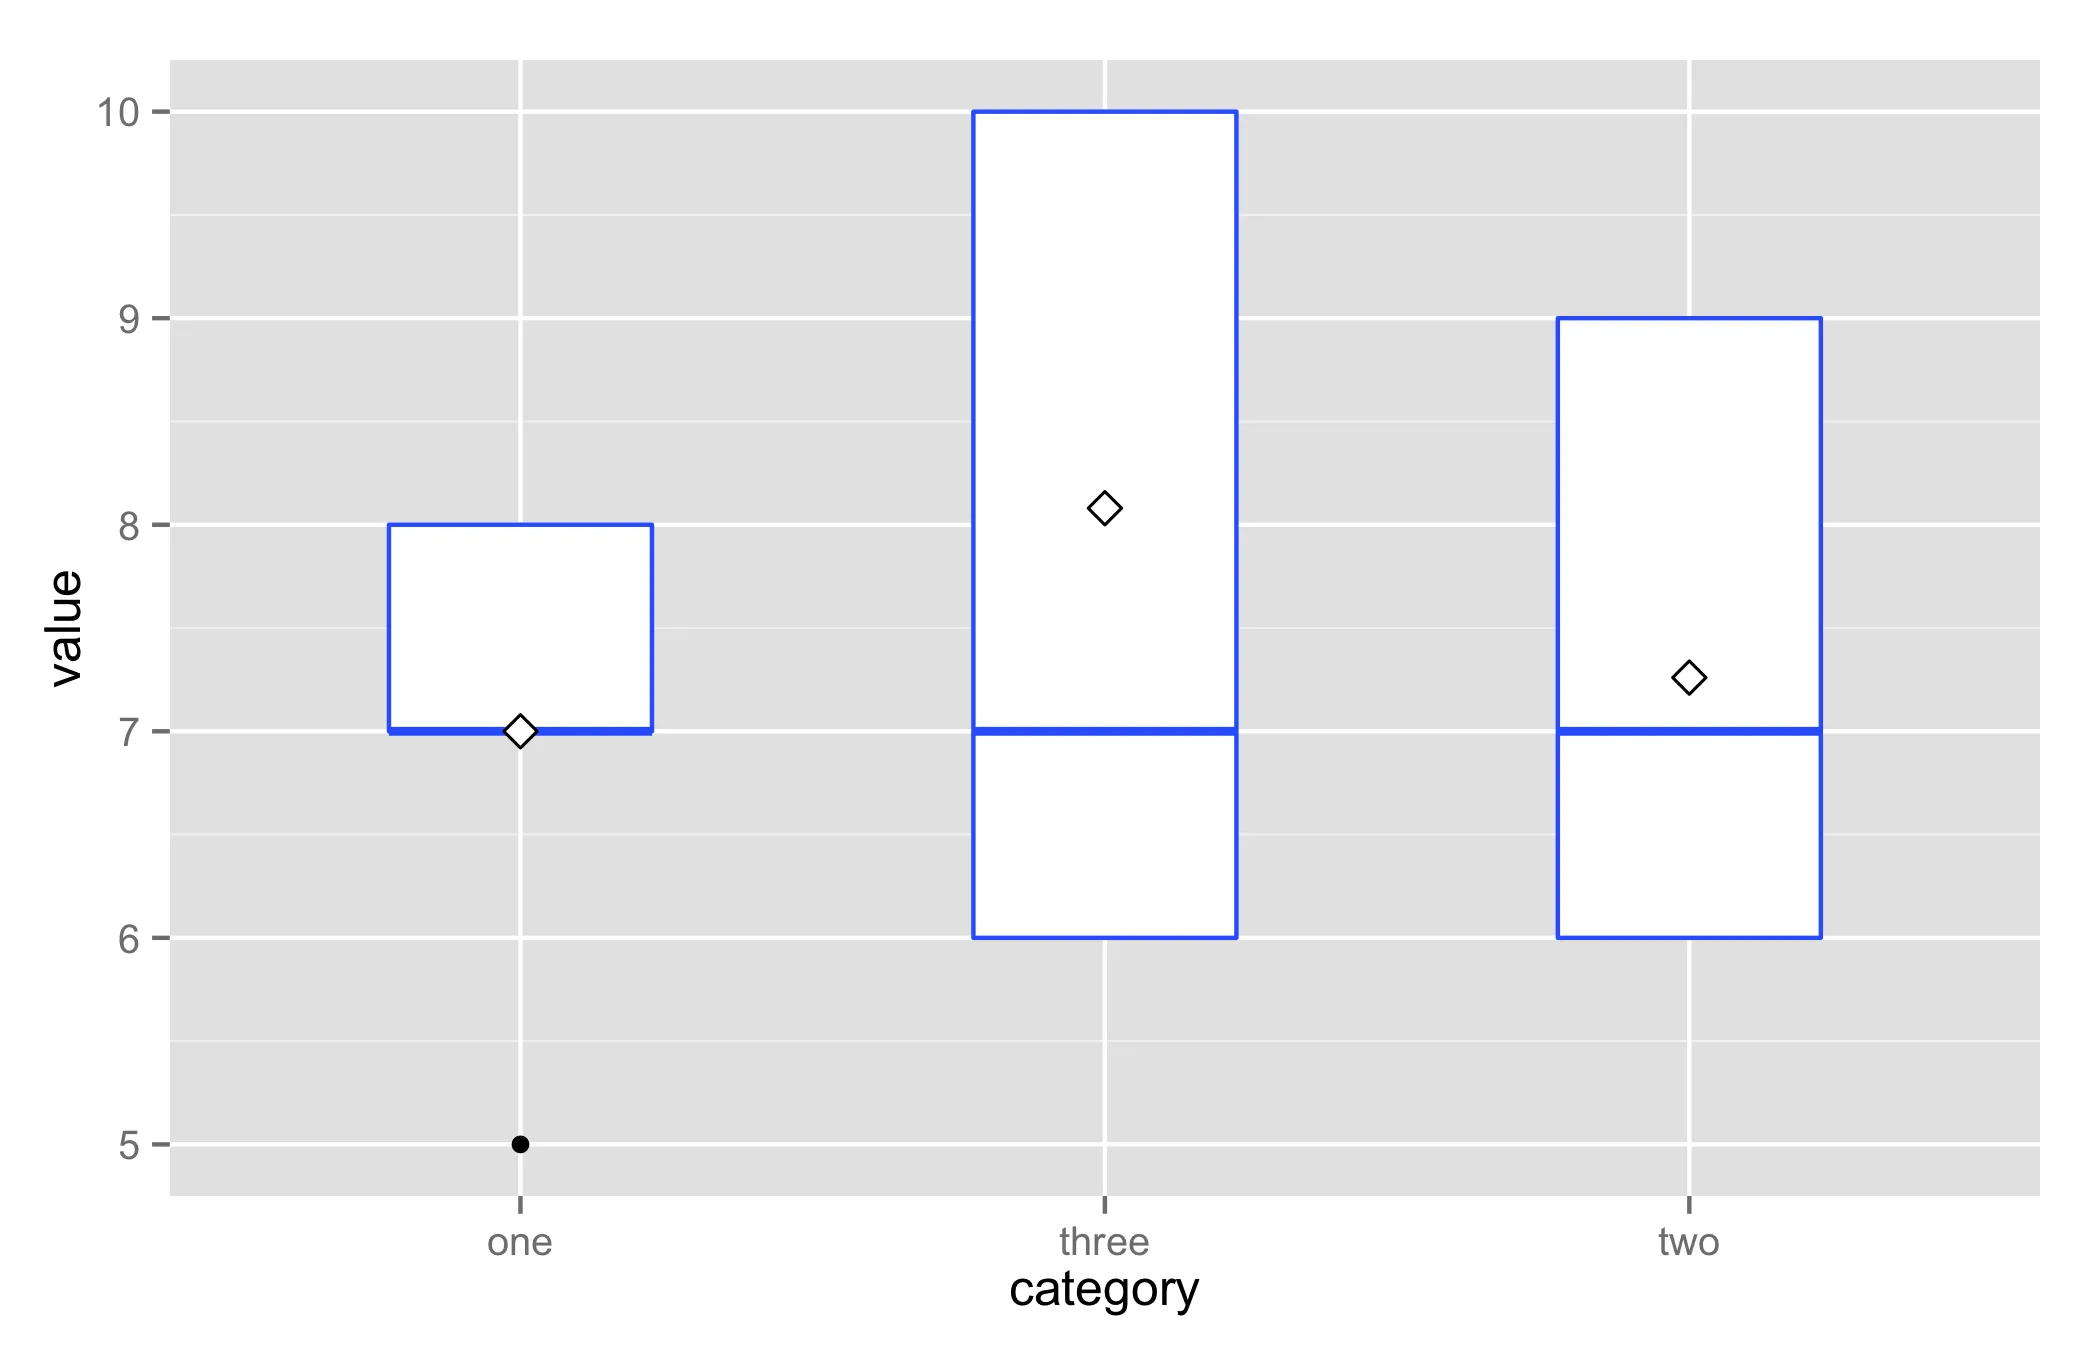
category wmean
1 one 7.00
2 three 8.08
3 two 7.26
#unweighted means added to boxplot (which works fine)
ggplot(df, aes(x = category, y = value, weight = weight)) +
geom_boxplot(width=0.6, colour = I("#3366FF")) +
stat_summary( fun.y ="mean", geom ="point", shape = 23,
size = 3, fill ="white")
我的问题是,如何在箱线图上显示加权平均值而不是未加权平均值?