我有一个类似这样的图:
import pandas as pd
import pandas_datareader as web
import datetime as dt
from datetime import timedelta
import matplotlib.pyplot as plt
#get the data
start_date = pd.to_datetime('2019-11-1')
end_date = pd.datetime.today()
df = web.DataReader('^gspc', 'yahoo', start_date, end_date)
df = df['Adj Close']
#build the plot
fig, ax1 = plt.subplots()
ax1.plot(df)
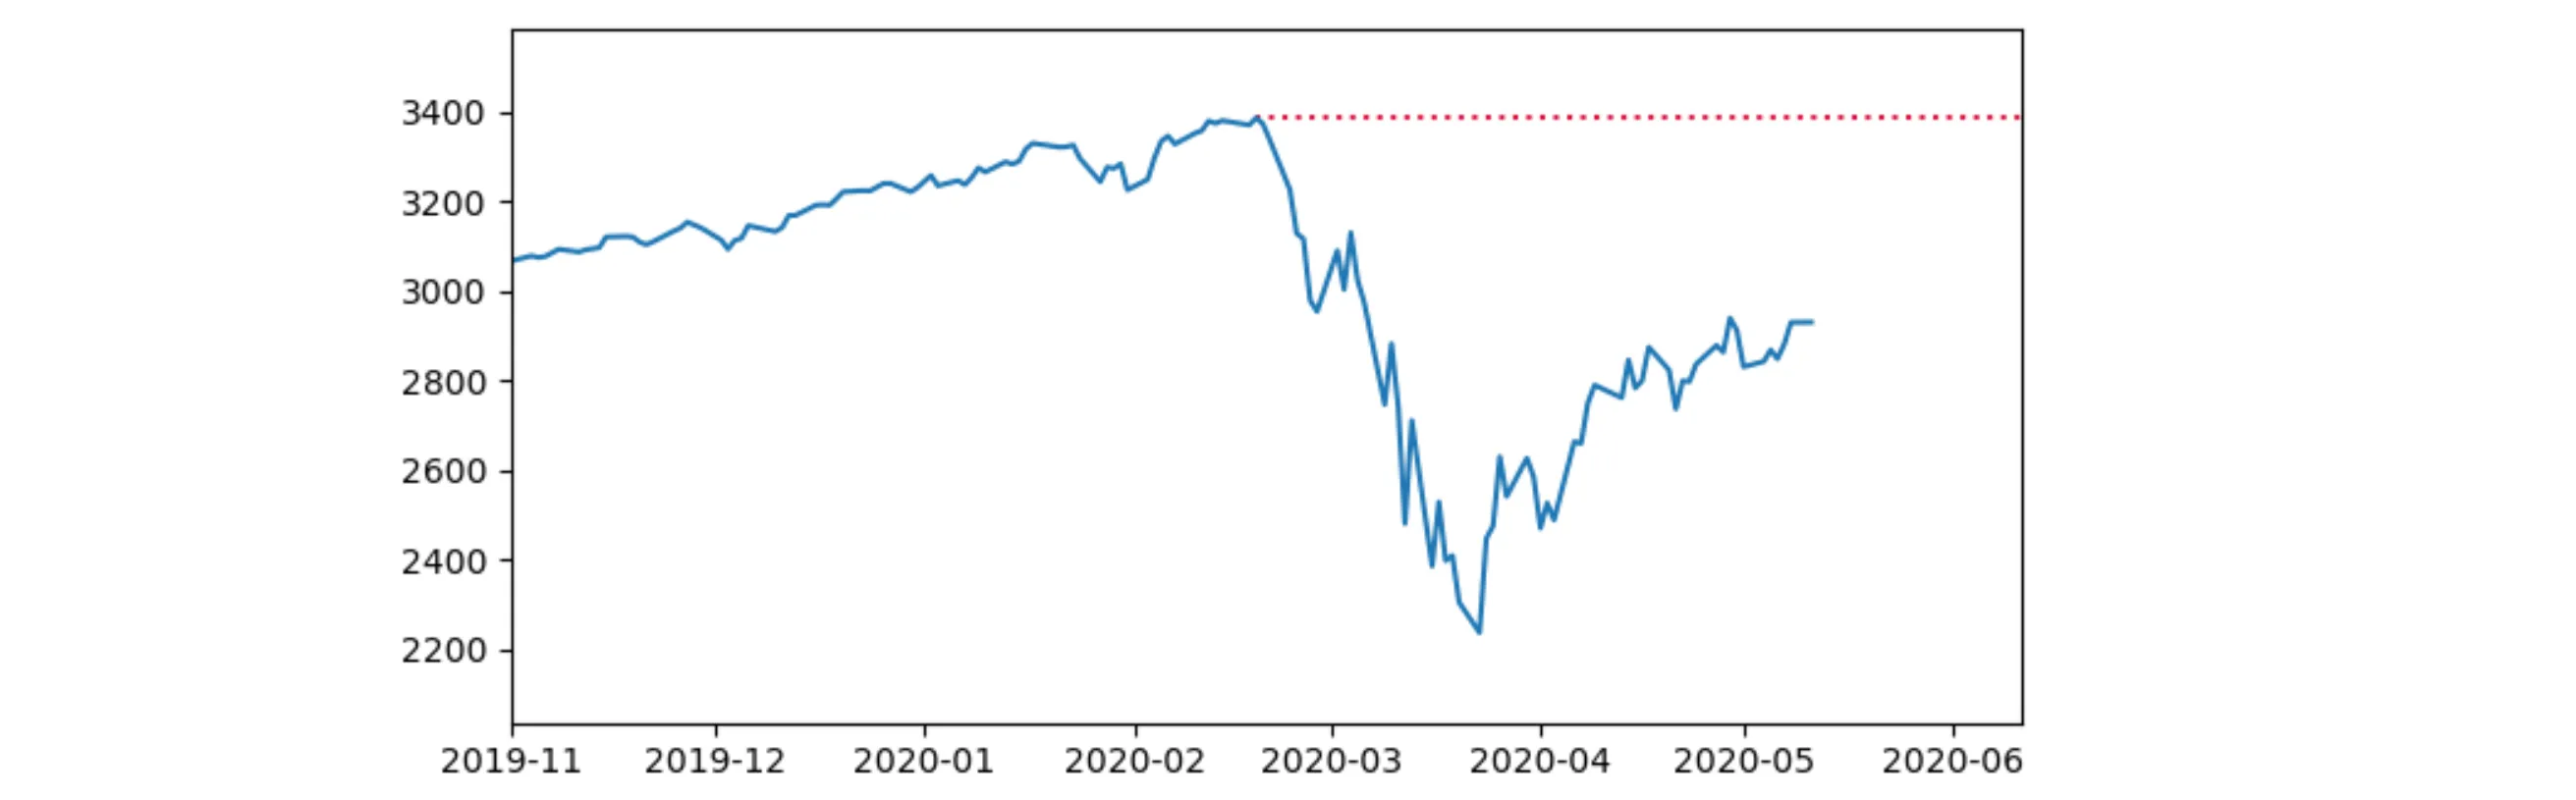
#set the axhline
ax1.axhline(df.max(),xmin=0,xmax=1)
ax1.set_xlim(start_date,end_date + timedelta(30))
ax1.set_ylim(df.min() -200, df.max() +200)
我尝试设置axhline,使其从df中最大值的那一天开始。因为索引是一个datetime对象,而axhline需要一个整数,所以我遇到了问题。
这是我尝试过的方法:
ax1.axhline(df.max(),xmin=df.idxmax(),xmax=1)
如何以最有效的方式将xmin设置为df中最大值日期?
谢谢。
ax1.plot(df)改为df.plot(ax=ax1)? - Quang Hoang