在绘制的图中,我想要画一条
axhline,并在其值上进行注释,有点类似于轮廓图示例here。例如,看起来像这样:--------- 0.13 -----------。这在matplotlib中是否可能?axhline,并在其值上进行注释,有点类似于轮廓图示例here。例如,看起来像这样:--------- 0.13 -----------。这在matplotlib中是否可能?您可以在线段的中心点创建一个普通的text对象,然后将背景颜色设置为与轴的颜色相同,这样水平线就不会在文本后面显示。
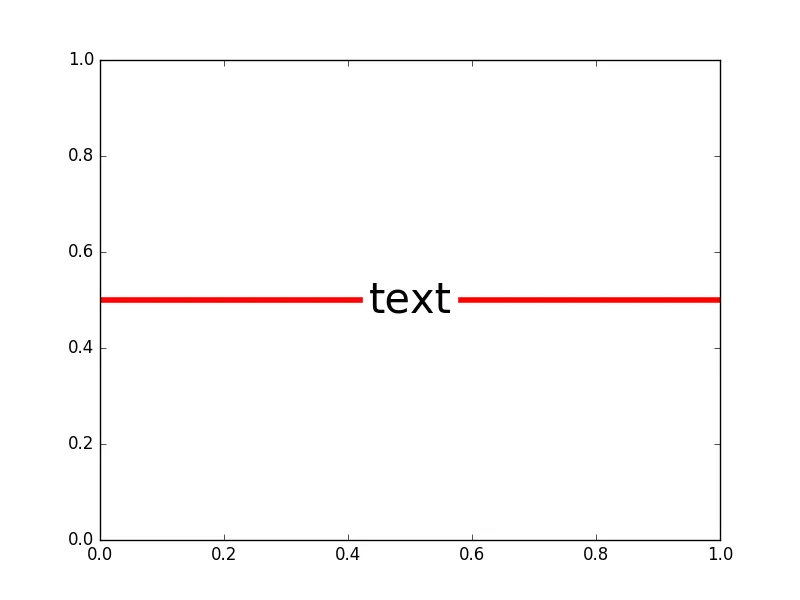
plt.axhline(linewidth=4, y=0.5, color='red')

plt.text(0.5, 0.5, 'text', fontsize=30, va='center', ha='center', backgroundcolor='w')
import matplotlib.pyplot as plt
import numpy as np
def hline_text(x, y, text, color="k", fontsize=12, linestyle="-", ax=None):
""" draw hline at y interrupted by text at x """
if ax is None:
ax = plt.gca()
text = f" {text} " # pad with single space
label = ax.text(x, y, text, color=color, fontsize=fontsize,
va="center", ha="center")
# draw text to get its bounding box
ax.get_figure().canvas.draw()
bbox = label.get_window_extent().transformed(ax.transData.inverted())
# add hlines next to bounding box
left, right = ax.get_xlim()
ax.hlines([y]*2, [left, bbox.x1], [bbox.x0, right], color=color, linestyle=linestyle)
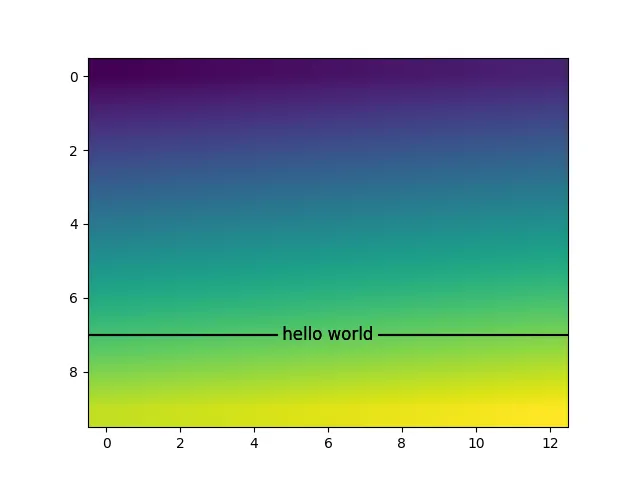
# draw gradient
x = np.arange(130).reshape((10, 13))
plt.imshow(x, interpolation='bilinear')
# add text & hline to current axes
hline_text(6, 7, "hello world")
plt.show()
plt.text(0.5, 0.5, 'text', fontsize=30, va='center', ha='center', backgroundcolor='w')中第一个0.5应该替换成什么? - mArkaxes相同的颜色。 - Suever