我有以下代码。它使用 Pandas 中的 Matplotlib 包装器:
import pandas as pd
import io
import matplotlib
import matplotlib.pyplot as plt

test=u"""Cell,Value
Bcells,0.056304
DendriticCells,0.3155388
Macrophages,0.131430
"""

tableau10=[ "#17BECF", "#BCBD22", "#7F7F7F", ]

toplot_df = pd.read_csv(io.StringIO(test))
toplot_df.set_index('Cell',inplace=True)
xlabels =  toplot_df.index.values
barplot   = toplot_df.plot(kind="bar", figsize=(17,17), \
                          color = tableau10, \
                          width=0.7,\
                          fontsize = 30,\
                          legend=False,
                          ylim = (0,0.5),
                          subplots=False)

ax = plt.gca()
ax.set_xticklabels(xlabels, rotation=30, ha='right')

# How to to make this to the back
plt.axhline(y=0.1, linewidth=1, color='r',zorder=1)
plt.xlabel("")
plt.ylabel("Score", fontsize=30, fontweight="bold")
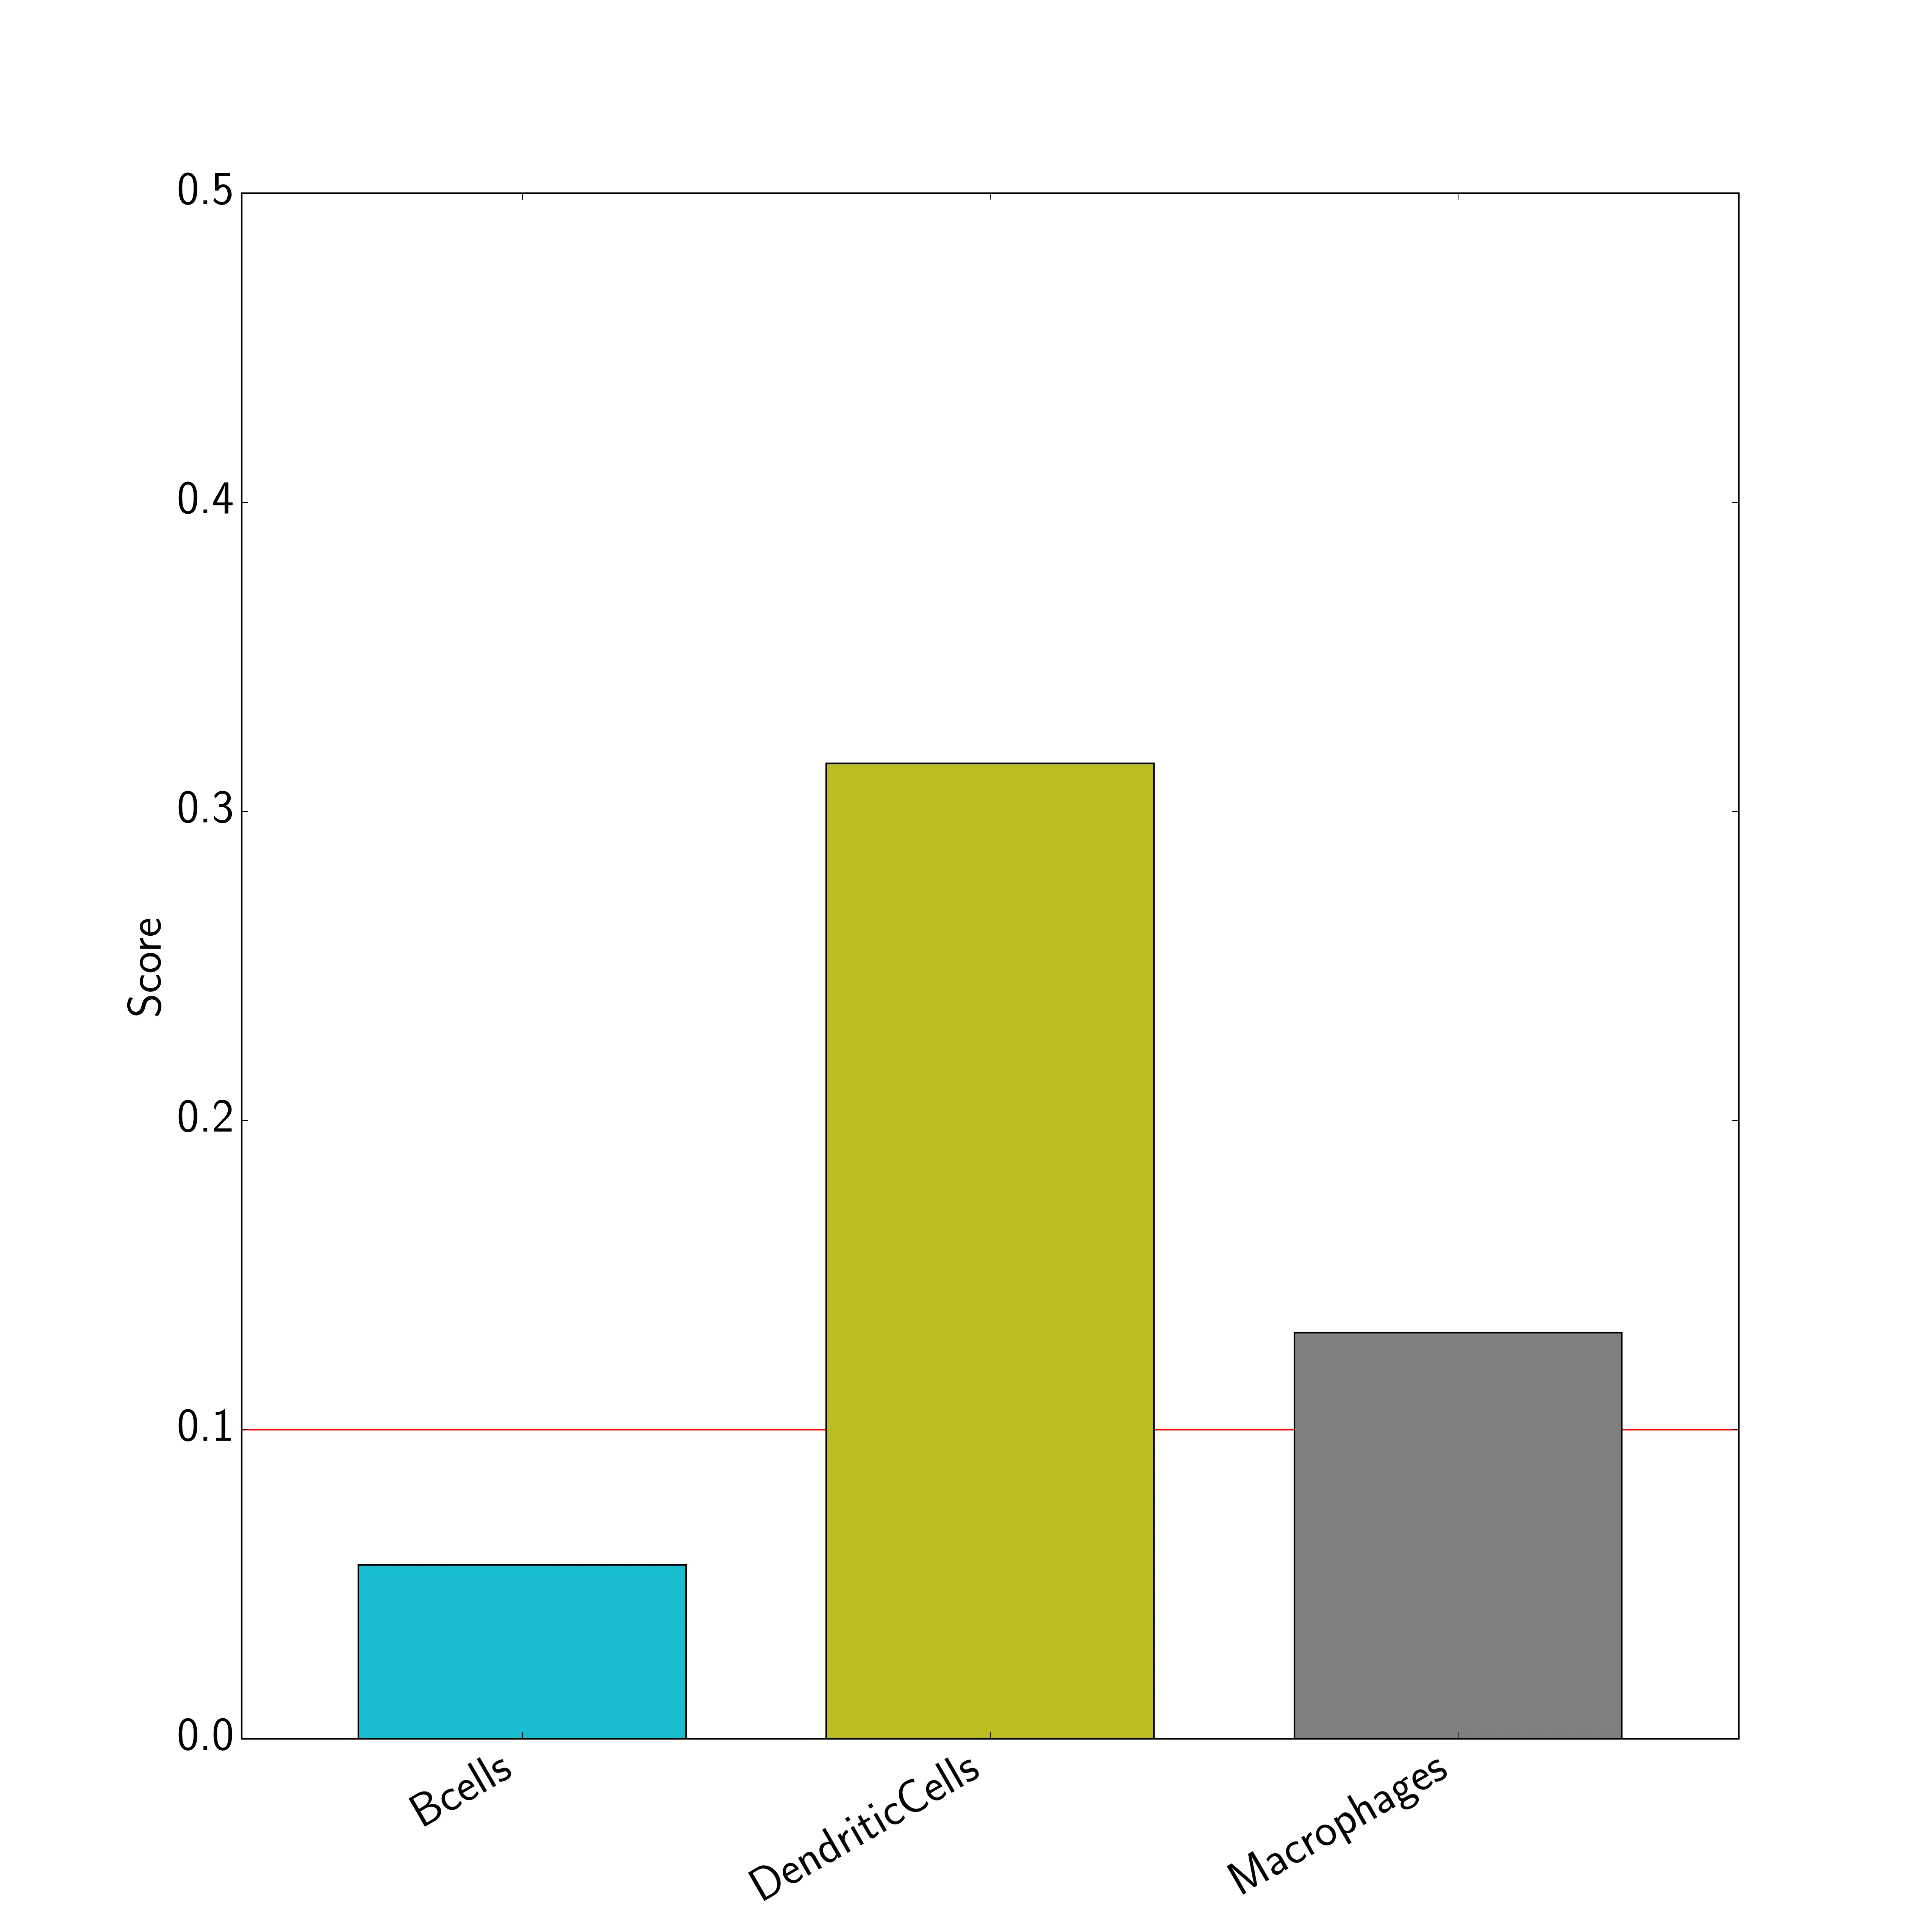
它生成了这个图像:
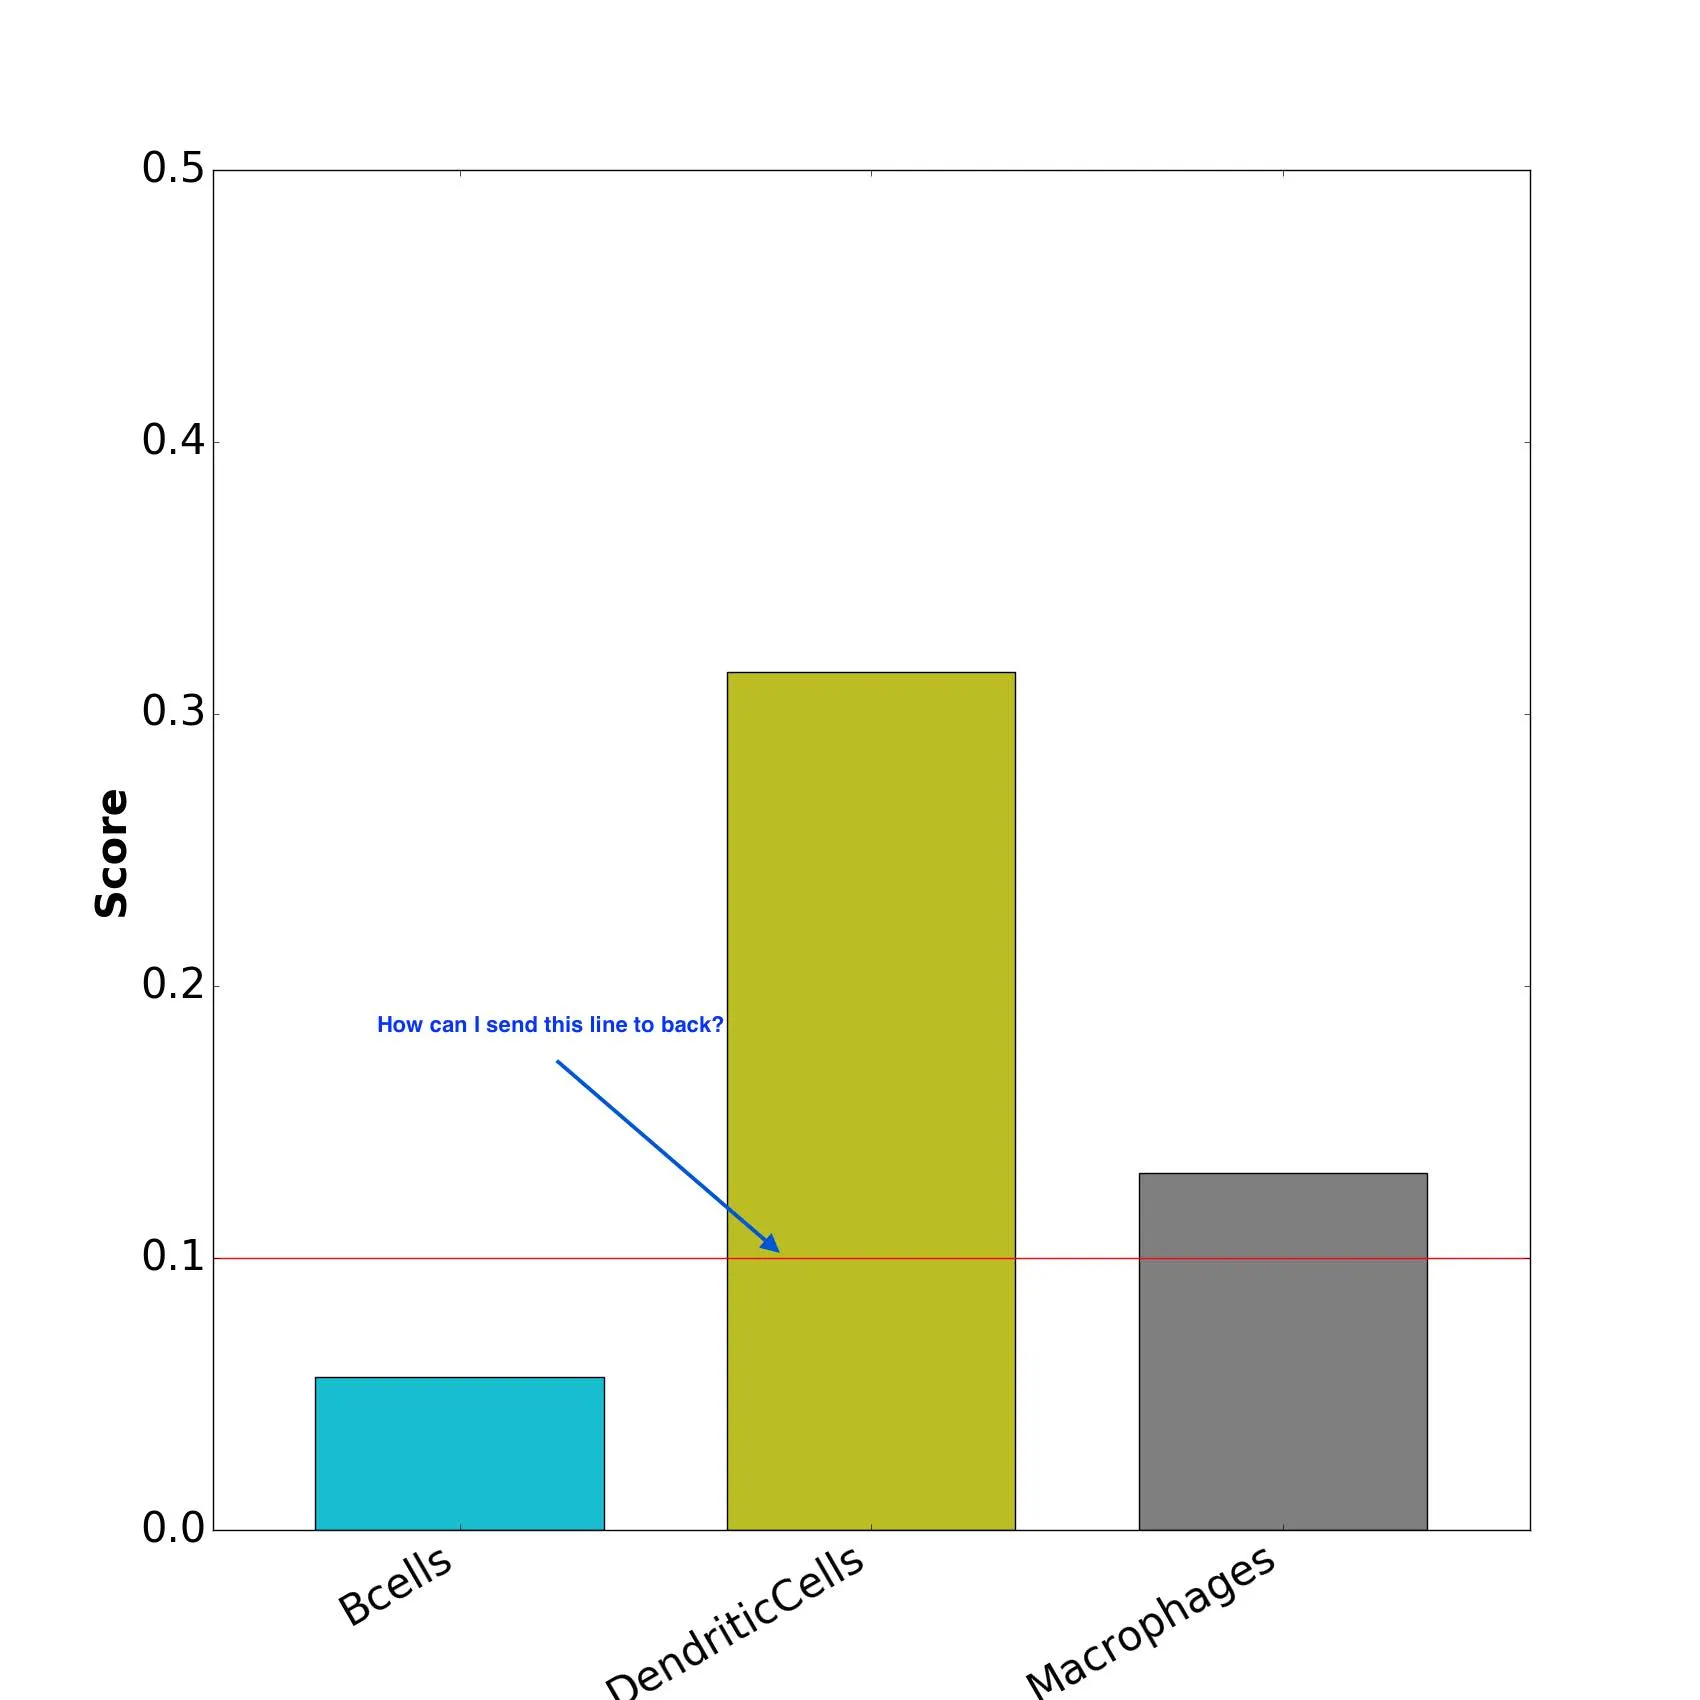
如上所述。 我该如何将axhline放置在背景中呢?
我试过使用zorder,但并不起作用。