library( ggplot2 )
library( gridExtra )
p1 <- qplot( rnorm( 10 ), rnorm( 10 ) )
p2 <- qplot( rnorm( 10 ), rnorm( 10 ) )
p3 <- qplot( rnorm( 10 ), rnorm( 10 ) )
p4 <- qplot( rnorm( 10 ), rnorm( 10 ) )
p5 <- qplot( rnorm( 10 ), rnorm( 10 ) )
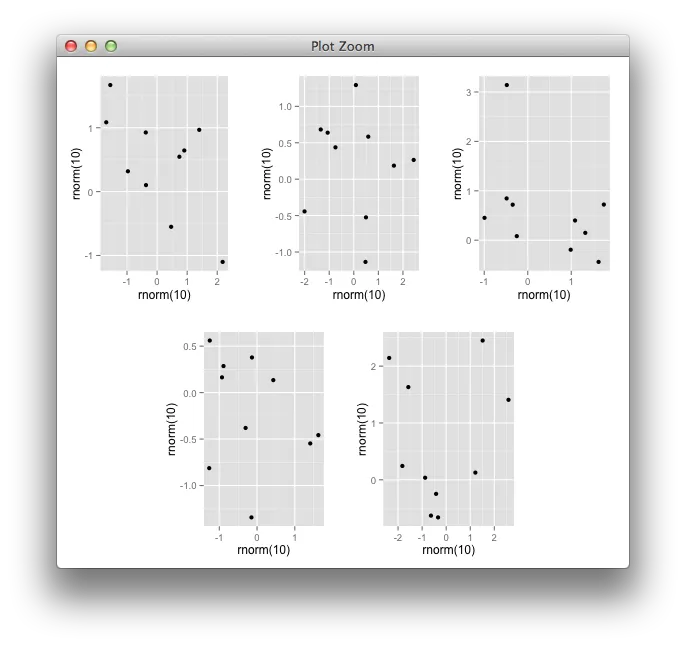
grid.arrange( p1, p2, p3, p4, p5, nrow=2 )
我想把下面的两个图居中。怎样才能做到呢?我可以使用
split.screen来实现,但我不知道如何使用ggplot2来实现。 ggplot2有更酷炫的图形。提前感谢!
PK
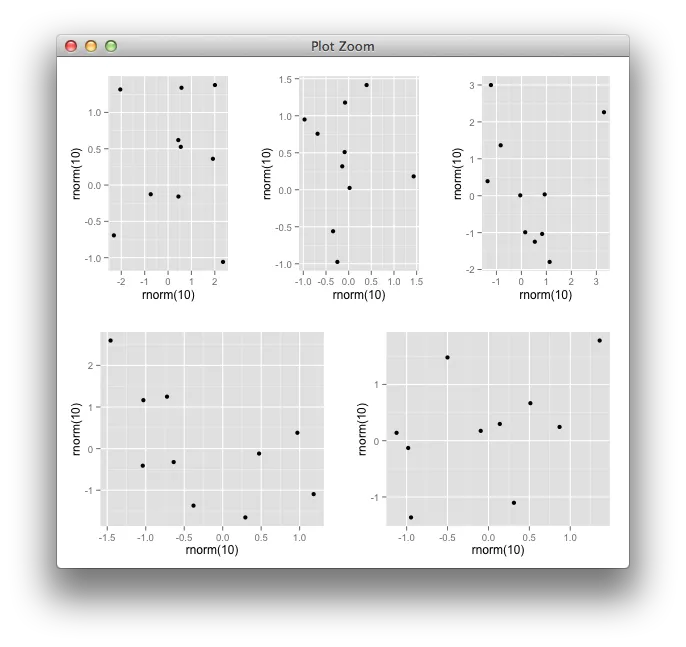
gtable答案。+1 - Tyler Rinker