我正在尝试使用ggplot2和ggpubr包,以星号的形式向我的箱线图添加显著性水平,但我有许多比较,只想显示显著的那些。
我尝试在stat_compare_means中使用hide.ns=TRUE选项,但它明显不起作用,这可能是ggpubr包中的一个错误。
此外,您可以看到我从成对的wilcox.test比较中省略了组“PGMC4”;我如何在kruskal.test中也省略该组?
我最后一个问题是显著性水平是如何工作的?例如,*表示小于0.05的显着性,**表示小于0.025的显着性,***表示小于0.01的显着性? ggpubr使用的是什么约定?它显示p值还是调整后的p值?如果是后者,调整方法是什么?BH?
请查看下面的MWE以及参考此链接和这个链接。
我尝试在stat_compare_means中使用hide.ns=TRUE选项,但它明显不起作用,这可能是ggpubr包中的一个错误。
此外,您可以看到我从成对的wilcox.test比较中省略了组“PGMC4”;我如何在kruskal.test中也省略该组?
我最后一个问题是显著性水平是如何工作的?例如,*表示小于0.05的显着性,**表示小于0.025的显着性,***表示小于0.01的显着性? ggpubr使用的是什么约定?它显示p值还是调整后的p值?如果是后者,调整方法是什么?BH?
请查看下面的MWE以及参考此链接和这个链接。
##############################
##MWE
set.seed(5)
#test df
mydf <- data.frame(ID=paste(sample(LETTERS, 163, replace=TRUE), sample(1:1000, 163, replace=FALSE), sep=''),
                   Group=c(rep('C',10),rep('FH',10),rep('I',19),rep('IF',42),rep('NA',14),rep('NF',42),rep('NI',15),rep('NS',10),rep('PGMC4',1)),
                   Value=rnorm(n=163))
#I don't want to compare PGMC4 cause I have only onw sample
groups <- as.character(unique(mydf$Group[which(mydf$Group!="PGMC4")]))
#function to make combinations of groups without repeating pairs, and avoiding self-combinations
expand.grid.unique <- function(x, y, include.equals=FALSE){
    x <- unique(x)
    y <- unique(y)
    g <- function(i){
        z <- setdiff(y, x[seq_len(i-include.equals)])
        if(length(z)) cbind(x[i], z, deparse.level=0)
    }
    do.call(rbind, lapply(seq_along(x), g))
}
#all pairs I want to compare
combs <- as.data.frame(expand.grid.unique(groups, groups), stringsAsFactors=FALSE)
head(combs)
my.comps <- as.data.frame(t(combs), stringsAsFactors=FALSE)
colnames(my.comps) <- NULL
rownames(my.comps) <- NULL
#pairs I want to compare in list format for stat_compare_means
my.comps <- as.list(my.comps)
head(my.comps)
pdf(file="test.pdf", height=20, width=25)
print(#or ggsave()
  ggplot(mydf, aes(x=Group, y=Value, fill=Group)) + geom_boxplot() +
    stat_summary(fun.y=mean, geom="point", shape=5, size=4) +
    scale_fill_manual(values=myPal) +
    ggtitle("TEST TITLE") +
    theme(plot.title = element_text(size=30),
      axis.text=element_text(size=12),
      axis.text.x = element_text(angle=45, hjust=1),
      axis.ticks = element_blank(),
      axis.title=element_text(size=20,face="bold"),
      legend.text=element_text(size=16)) +
  stat_compare_means(comparisons=my.comps, method="wilcox.test", label="p.signif", size=14) + #WHY DOES hide.ns=TRUE NOT WORK??? WHY DOES size=14 NOT WORK???
  stat_compare_means(method="kruskal.test", size=14) #GLOBAL COMPARISON ACROSS GROUPS (HOW TO LEAVE PGMC4 OUT OF THIS??)
)
dev.off()
##############################
这个 MWE 将会生成以下的箱线图:
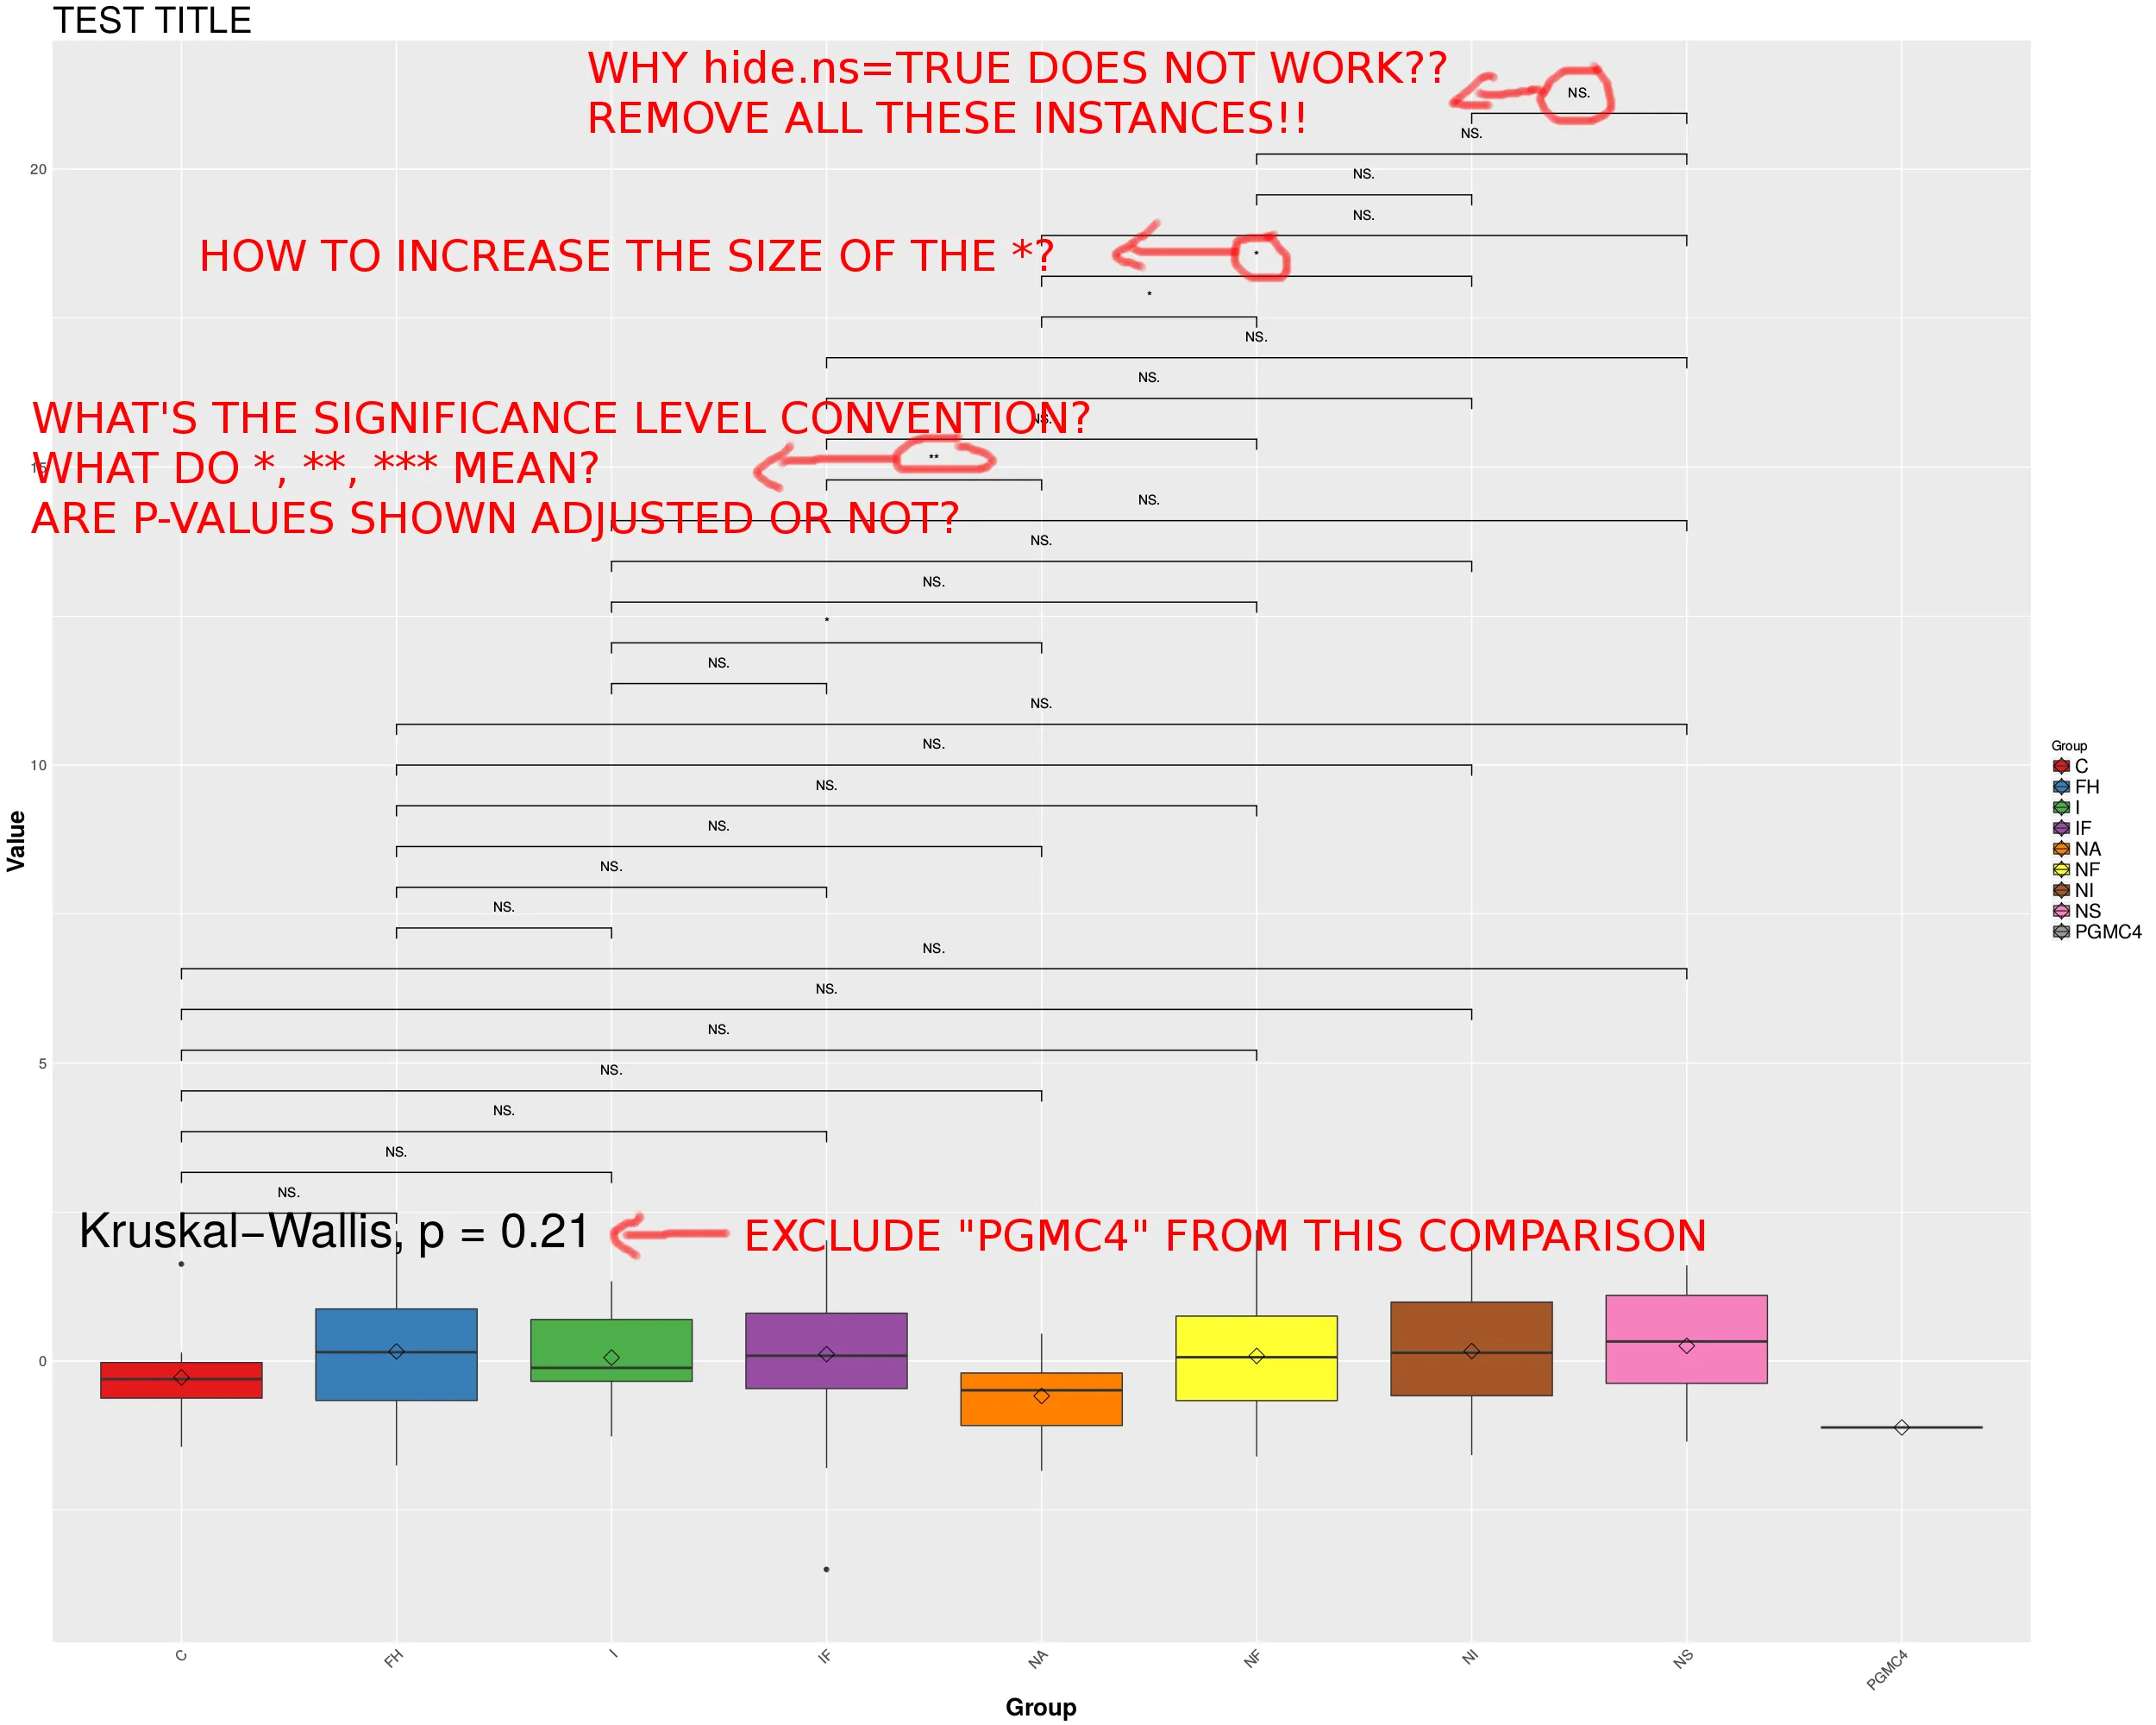
问题如下:
1- 如何使hide.ns=TRUE起作用?
2- 如何增加*的大小?
3- 如何从kruskal.test比较中排除一组?
4- ggpubr使用的*约定是什么,显示的p值是否已经调整?
非常感谢!
编辑
另外,在进行时
stat_compare_means(comparisons=my.comps, method="wilcox.test", p.adjust.method="BH")
我得到的p值与进行时不同
wilcox.test(Value ~ Group, data=mydf.sub)$p.value
其中,mydf.sub是给定两组比较的mydf的子集()。
ggpubr在这里做什么?它如何计算p值?
编辑2
请帮助我,解决方案不一定要使用ggpubr(但必须使用 ggplot2 ),我只需要能够隐藏NS并使星号的大小更大,并且进行与wilcox.test()+ p.adjust(method"BH")相同的p值计算。
谢谢!
- 是的确实。看起来是一个bug。
- 没有头绪。
- 使用
- 将结果与
- Romanstat_compare_means(data=mydf[ mydf$Group != "PGMC4", ],aes(x=Group, y=Value, fill=Group), size=5)。pairwise.wilcox.test(mydf$Value, mydf$Group, p.adjust.method = "none")进行比较。library(ggsignif);geom_signif()和注释。请参见此处的最后一个答案:https://dev59.com/Y2Qn5IYBdhLWcg3wIUFn#27073333 - Roman