这里是对@Marcus的优秀解决方案进行包装的内容,以便更方便地使用和更灵活:
geom_boxplot2 <- function(mapping = NULL, data = NULL, stat = "boxplot", position = "dodge2",
..., outlier.colour = NULL, outlier.color = NULL, outlier.fill = NULL,
outlier.shape = 1, outlier.size = 1.5, outlier.stroke = 0.5,
outlier.alpha = NULL, notch = FALSE, notchwidth = 0.5, varwidth = FALSE,
na.rm = FALSE, show.legend = NA, inherit.aes = TRUE,
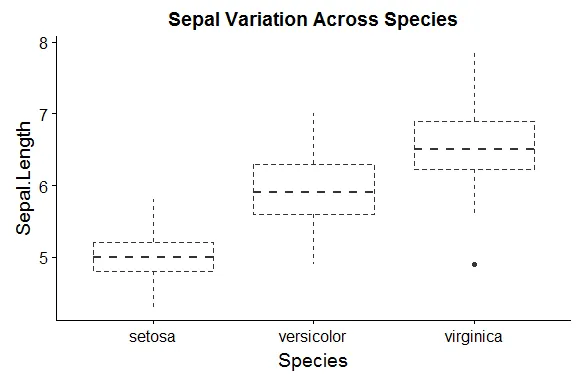
linetype = "dashed"){
list(
geom_boxplot(mapping = mapping, data = data, stat = stat, position = position,
outlier.colour = outlier.colour, outlier.color = outlier.color,
outlier.fill = outlier.fill, outlier.shape = outlier.shape,
outlier.size = outlier.size, outlier.stroke = outlier.stroke,
outlier.alpha = outlier.alpha, notch = notch,
notchwidth = notchwidth, varwidth = varwidth, na.rm = na.rm,
show.legend = show.legend, inherit.aes = inherit.aes,
linetype = linetype, ...),
stat_boxplot(aes(ymin = ..lower.., ymax = ..upper..), outlier.shape = 1) ,
stat_boxplot(geom = "errorbar", aes(ymin = ..ymax..)) ,
stat_boxplot(geom = "errorbar", aes(ymax = ..ymin..)) ,
theme_classic(),
theme(plot.title = element_text(hjust = 0.5,
size = 14,
face = "bold"),
panel.border = element_rect(linetype = "solid",
colour = "black", fill = "NA", size = 0.5))
)
}
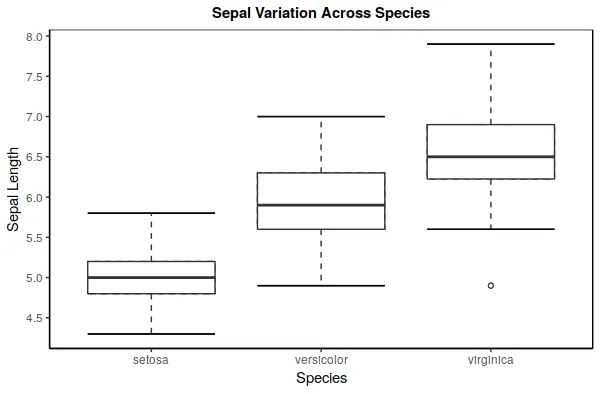
ggplot(data = iris, aes(x = Species, y = Sepal.Length)) +
geom_boxplot2() +
scale_y_continuous(breaks = seq(4.5, 8.0, 0.5)) +
labs(title = "Sepal Variation Across Species", y = "Sepal Length")

outlier.color = 'black'和outlier.fill = 'white'来复制这些圆形。 - VFregugliageom_boxplot()版本,并通过添加此类参数来修改传递到https://github.com/tidyverse/ggplot2/blob/master/R/geom-boxplot.r#L254-L259的内容。 - hrbrmstr