出于某些原因,当我尝试使用
我最终得到了这样的东西: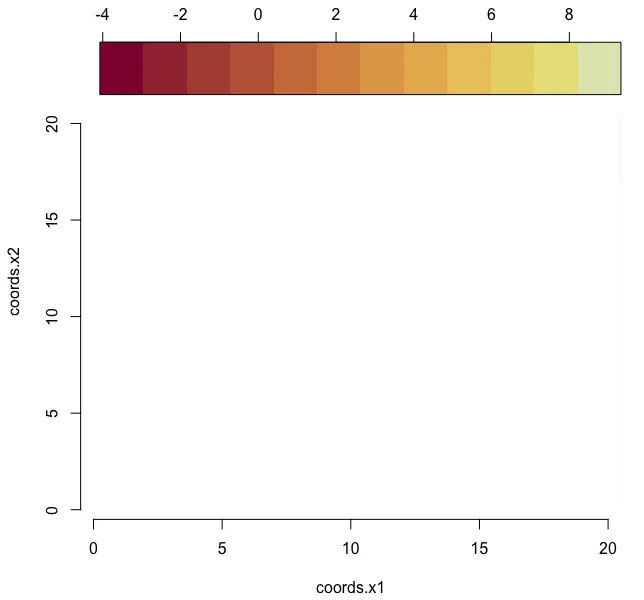 例如:空白图
有人能告诉我这里发生了什么?!
例如:空白图
有人能告诉我这里发生了什么?!
plot() 函数来可视化 RandomFields 包中的 RFsimulate() 函数的输出时,输出总是一个空图。我只是在使用帮助文件中包含的示例代码。## first let us look at the list of implemented models
RFgetModelNames(type="positive definite", domain="single variable",
iso="isotropic")
## our choice is the exponential model;
## the model includes nugget effect and the mean:
model <- RMexp(var=5, scale=10) + # with variance 4 and scale 10
RMnugget(var=1) + # nugget
RMtrend(mean=0.5) # and mean
## define the locations:
from <- 0
to <- 20
x.seq <- seq(from, to, length=200)
y.seq <- seq(from, to, length=200)
simu <- RFsimulate(model=model, x=x.seq, y=y.seq)
str(simu)
这将产生:
Formal class 'RFspatialGridDataFrame' [package ""] with 5 slots
  ..@ .RFparams  :List of 5
  .. ..$ n         : num 1
  .. ..$ vdim      : int 1
  .. ..$ T         : num(0)
  .. ..$ coordunits: NULL
  .. ..$ varunits  : NULL
  ..@ data       :'data.frame': 441 obs. of  1 variable:
  .. ..$ variable1: num [1:441] 4.511 2.653 3.951 0.771 2.718 ...
  ..@ grid       :Formal class 'GridTopology' [package "sp"] with 3 slots
  .. .. ..@ cellcentre.offset: Named num [1:2] 0 0
  .. .. .. ..- attr(*, "names")= chr [1:2] "coords.x1" "coords.x2"
  .. .. ..@ cellsize         : Named num [1:2] 1 1
  .. .. .. ..- attr(*, "names")= chr [1:2] "coords.x1" "coords.x2"
  .. .. ..@ cells.dim        : int [1:2] 21 21
  ..@ bbox       : num [1:2, 1:2] -0.5 -0.5 20.5 20.5
  .. ..- attr(*, "dimnames")=List of 2
  .. .. ..$ : chr [1:2] "coords.x1" "coords.x2"
  .. .. ..$ : chr [1:2] "min" "max"
  ..@ proj4string:Formal class 'CRS' [package "sp"] with 1 slot
  .. .. ..@ projargs: chr NA
...所以数据已被模拟,但当我调用时
plot(simu)
我最终得到了这样的东西:
例如:空白图
有人能告诉我这里发生了什么?!
x11(); plot(simu)会打开一个新窗口,并正确地绘制出随机场。 - xraynaud