我尝试在ggplot中绘制一个条形图,y轴是每个物种的动物数量,x轴是国家。我已经成功绘制了图表,但是当我尝试勾勒出每个物种和条形时,就会在图表中每个值之间得到边框。
我还尝试使用reprex包创建一个更漂亮的问题,包括我的图表,但显然我声望太低无法发布图片。
所以我只尝试代码:
我还尝试使用reprex包创建一个更漂亮的问题,包括我的图表,但显然我声望太低无法发布图片。
所以我只尝试代码:
library(tidyverse)

country <- c( "AA", "AA", "BB", "BB", "CC", "CC", "DD", "DD", "EE", "EE")
sheep <-c(130, 146, 12, 15, 19, 0, 44, 57, 99, 123)
cattle <- c(11, 34, 221, 0, 91, 49, 33, 28, 19, 10)
pigs <- c(55, 0, 34, 48, 54, 0, 33, 59, 112, 23)

animals_wide <- data_frame(country, sheep, pigs, cattle)
animals_long <- animals_wide %>%
  gather(key = species, value = numbers, -country)

glimpse(animals_long)
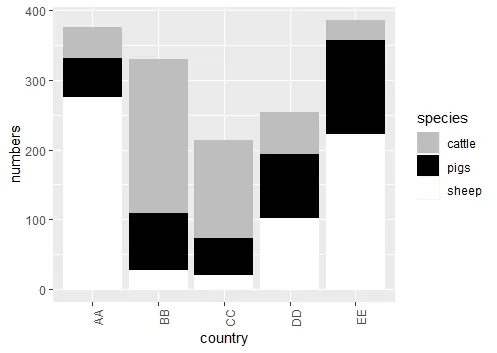
ggplot(animals_long, aes(country, numbers, fill = species)) +
  geom_bar(stat = "identity") +
  theme(axis.text.x = element_text(angle = 90, hjust = 1)) +
  scale_fill_manual(values=c("gray", "black", "white"))
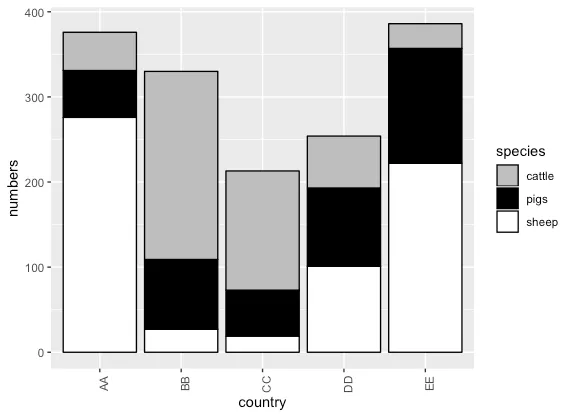
ggplot(animals_long, aes(country, numbers, fill = species)) +
  geom_bar(stat = "identity", color = "black") +
  theme(axis.text.x = element_text(angle = 90, hjust = 1)) +
  scale_fill_manual(values=c("gray", "black", "white"))