Plotly垂直范围未自动调整

3
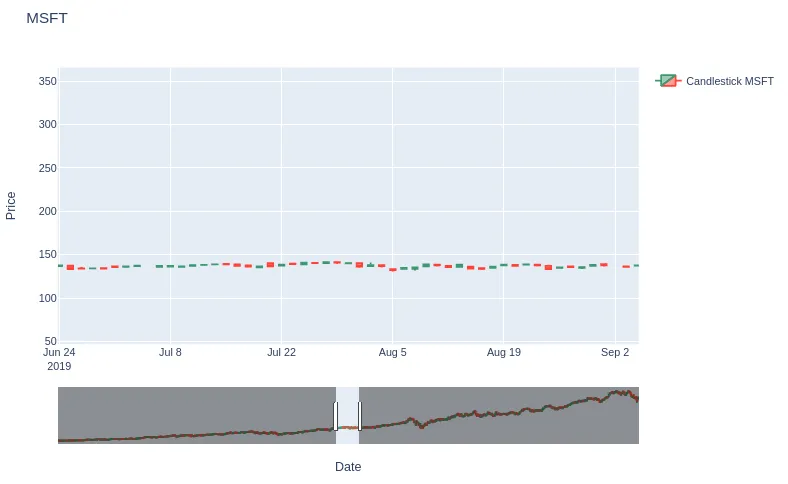
以下代码使用范围滑块绘制蜡烛图。如果我将滑块缩小,我希望在垂直比例尺上进行缩放。如何实现这一点?我期望有某种设置可以做到这一点,但我找不到它。目前的结果可能看起来像屏幕截图;显然不是最佳的。大部分垂直比例尺仍未被使用。如何解决这个问题?

enter image description here


import sys
import pandas as pd
import plotly.graph_objects as go
from datetime import datetime

from Downloader import CDownloader
# import matplotlib.dates as mdates # Styling dates

class CGraphs:
    def Candlestick(self, aSymbolName:str):
        #  Warning, this function reads from disk, so it is slow.
        print(sys._getframe().f_code.co_name, ": Started. aSymbolName ", aSymbolName)
        
        downloader : CDownloader = CDownloader()
        
        df_ohlc : pd.DataFrame = downloader.GetHistoricalData(aSymbolName)
        print("df_ohlc", df_ohlc)
        
        graph_candlestick = go.Figure()
        
        candle = go.Candlestick(x     = df_ohlc['Date'],
                                open  = df_ohlc['Open'],
                                high  = df_ohlc['High'],
                                low   = df_ohlc['Low'],
                                close = df_ohlc['Close'],
                                name  = "Candlestick " + aSymbolName)
        
        graph_candlestick.add_trace(candle)
        graph_candlestick.update_xaxes(title="Date", rangeslider_visible=True)
        graph_candlestick.update_yaxes(title="Price", autorange=True)     
        
        graph_candlestick.update_layout(
                title               = aSymbolName,
                height              = 600,
                width               = 900, 
                showlegend          = True)
        
        graph_candlestick.update_layout(xaxis_rangebreaks = [ dict(bounds=["sat", "mon"]) ])
        
        graph_candlestick.show()        
        print(sys._getframe().f_code.co_name, ": Finished. aSymbolName ", aSymbolName)
         
graphs:CGraphs = CGraphs()

graphs.Candlestick("MSFT")

2个回答

1

这个功能在plotly-python中不可用,目前是Plotly团队的一个未解决问题

我认为你可以在plotly-dash中构建这个功能,因为这个库支持回调。例如,使用服务器端实现(在这个论坛上@kkollsg的答案的帮助下):

import dash
from dash import Output, Input, State, dcc, html
import plotly.graph_objs as go
import numpy as np
import pandas as pd
import datetime

class CGraphs:
    def makeCandlestick(self, aSymbolName:str):
        #  Warning, this function reads from disk, so it is slow.
        # print(sys._getframe().f_code.co_name, ": Started. aSymbolName ", aSymbolName)
        
        # downloader : CDownloader = CDownloader()
        
        # df_ohlc : pd.DataFrame = downloader.GetHistoricalData(aSymbolName)
        ## load some similar stock data

        df_ohlc = pd.read_csv('https://raw.githubusercontent.com/plotly/datasets/master/finance-charts-apple.csv')
        df_ohlc.rename(columns=dict(zip(['AAPL.Open', 'AAPL.High', 'AAPL.Low', 'AAPL.Close'],['Open','High','Low','Close'])), inplace=True)

        # print("loading data")
        # print("df_ohlc", df_ohlc)
        
        graph_candlestick = go.Figure()
        
        candle = go.Candlestick(x     = df_ohlc['Date'],
                                open  = df_ohlc['Open'],
                                high  = df_ohlc['High'],
                                low   = df_ohlc['Low'],
                                close = df_ohlc['Close'],
                                name  = "Candlestick " + aSymbolName)
        
        graph_candlestick.add_trace(candle)
        graph_candlestick.update_xaxes(title="Date", rangeslider_visible=True)
        graph_candlestick.update_yaxes(title="Price", autorange=True)
        
        graph_candlestick.update_layout(
                title               = aSymbolName,
                height              = 600,
                width               = 900, 
                showlegend          = True)
        
        graph_candlestick.update_layout(xaxis_rangebreaks = [ dict(bounds=["sat", "mon"]) ])
    
        app = dash.Dash()

        app.layout = html.Div(
            html.Div([
                dcc.Graph(id='graph_candlestick',figure=graph_candlestick)
            ])
        )

        #Server side implementation (slow)
        @app.callback(
        Output('graph_candlestick','figure'),
        [Input('graph_candlestick','relayoutData')],[State('graph_candlestick', 'figure')]
        )
        def update_result(relOut,Fig):
            
            if relOut == None:
                return Fig
            
            ## if you don't use the rangeslider to adjust the plot, then relOut.keys() won't include the key xaxis.range
            elif "xaxis.range" not in relOut.keys():
                newLayout = go.Layout(
                    title=aSymbolName,
                    height=600,
                    width=800,
                    showlegend=True,
                    yaxis=dict(autorange=True),
                    template="plotly"
                )
                
                Fig['layout']=newLayout
                return Fig

            else:
                ymin = df_ohlc.loc[df_ohlc['Date'].between(relOut['xaxis.range'][0], relOut['xaxis.range'][1]),'Low'].min()
                ymax = df_ohlc.loc[df_ohlc['Date'].between(relOut['xaxis.range'][0], relOut['xaxis.range'][1]),'High'].max()

                newLayout = go.Layout(
                    title=aSymbolName,
                    height=600,
                    width=800,
                    showlegend=True,
                    xaxis=dict(
                        rangeslider_visible=True,
                        range=relOut['xaxis.range']
                    ),
                    yaxis=dict(range=[ymin,ymax]),
                    template="plotly"
                )
                
                Fig['layout']=newLayout
                return Fig

        app.run_server(debug=True)
         
graphs:CGraphs = CGraphs()
graphs.makeCandlestick("MSFT")

enter image description here


2
如果您知道如何做到这一点,我肯定会感激一些提示,谢谢。 - TradingDerivatives.eu
1
@TradingDerivatives.eu的回答已更新 - 希望这能帮到您! - Derek O

0
尽管已经得到了答案,我仍然转向Bokeh。由于对于没有经验的人来说,使用Bokeh也并非易事,因此我在这里分享一下我所实现的内容。希望能对未来的某个人有所帮助。
Python version      :  3.8.10 (default, Nov 26 2021, 20:14:08) 
IPython version     :  8.0.1
Tornado version     :  6.1
Bokeh version       :  2.4.2
BokehJS static path :  /home/.../.local/lib/python3.8/site-packages/bokeh/server/static
node.js version     :  (not installed)
npm version         :  (not installed)
Operating system    :  Linux-5.13.0-27-generic-x86_64-with-glibc2.29

结果:

enter image description here

实际代码:

def CandleStickBokeh(self, aSymbolName:str, aDataFrameOhlc = pd.DataFrame()):
# https://docs.bokeh.org/en/2.4.0/docs/gallery/candlestick.html

if 0 == aDataFrameOhlc.size:
    downloader : CDownloader = CDownloader()
    df_ohlc = downloader.GetHistoricalData(aSymbolName)
else:
    df_ohlc = aDataFrameOhlc

df_ohlc['to_datetime'] = pd.to_datetime(df_ohlc['Date'])

inc = df_ohlc['Close'] > df_ohlc['Open']
dec = df_ohlc['Close'] < df_ohlc['Open']
w = 12*60*60*1000 # half day in ms

tools = "pan,wheel_zoom,box_zoom,reset,save"

figure_bokeh:bokeh.plotting.figure.Figure = figure(x_axis_type="datetime", tools=tools, width=1000, title = aSymbolName + " Candlestick")

figure_bokeh.xaxis.major_label_orientation = pi/4
figure_bokeh.grid.grid_line_alpha=0.3

figure_bokeh.segment(df_ohlc['to_datetime'], df_ohlc['High'], df_ohlc['to_datetime'], df_ohlc['Low'], color="black")
figure_bokeh.vbar(df_ohlc['to_datetime'][inc], w, df_ohlc['Open'][inc], df_ohlc['Close'][inc], fill_color="#D5E1DD", line_color="black")
figure_bokeh.vbar(df_ohlc['to_datetime'][dec], w, df_ohlc['Open'][dec], df_ohlc['Close'][dec], fill_color="#F2583E", line_color="black")

source = ColumnDataSource(data=dict(date=df_ohlc['to_datetime'], high=df_ohlc.High, low=df_ohlc.Low))

slider = DateRangeSlider(value=(min(df_ohlc['to_datetime'].values), max(df_ohlc['to_datetime'].values)), 
                            start=min(df_ohlc['to_datetime'].values), end=max(df_ohlc['to_datetime'].values), step=1)  

# The args dict links the variables in the Javascript code to the properties ('models') of Bokeh GUI elements.
# Here, the DateTimeSlider 'slider' is cb_obj, so these properties are linked by Bokey already.
# The properties to be explicitly linked are the horizontal and vertical range of figure_bokeh.
# Note that the slider has start and end members, but these are fixed by the data in 'source'.
# The slider values that can be changed by mouse dragging are cb_obj.value[0] and cb_obj.value[1].

callback = CustomJS(args=dict(slider=slider, x_range=figure_bokeh.x_range, y_range=figure_bokeh.y_range, source=source), code='''
    clearTimeout(window._autoscale_timeout);
    
    // the model that triggered the callback is cb_obj.
    //        if (Math.floor(Math.random() * 10000) == 0)
    //        {
    //            // Debug code if your console does not work. Tune the value in the condition to your needs.
    //            // Put displays the values you program in; can also be used to enter values manually.
    //            var s = new Date(start).toLocaleDateString("en-US")
    //            let xyz = prompt("Banana s " + s + " date[i] " + date[i].toString() + " x_selected_range_start " 
    //                   + x_selected_range_start.toString() + " end " + end.toString() , "Default");
    //        }
    
    var date = source.data.date,
        low = source.data.low,
        high = source.data.high,
        start = cb_obj.start,     // This looks like it is fixed and does not change with the slider.
        end = cb_obj.end,         // In milliseconds since epoch
        x_selected_range_start = cb_obj.value[0],  // In milliseconds since epoch
        x_selected_range_end   = cb_obj.value[1],  // In milliseconds since epoch
        y_min = Infinity,
        y_max = -Infinity;

    for (var i=0; i < date.length; ++i)
    {
        if (x_selected_range_start <= date[i] && date[i] <= x_selected_range_end)
        {
            y_max = Math.max(high[i], y_max);
            y_min = Math.min(low[i],  y_min);
        }
    }
    
    var pad = (y_max - y_min) * .05;

    window._autoscale_timeout = setTimeout(function()
        {
            x_range.start = x_selected_range_start
            x_range.end   = x_selected_range_end
            
            y_range.start = y_min - pad;
            y_range.end   = y_max + pad;
        }
    );
''')

slider.js_on_change('value', callback)

layout = column(figure_bokeh, slider)
show(layout)

网页内容由stack overflow 提供, 点击上面的
可以查看英文原文,
原文链接