Plotly:当行数大于500时,范围滑块未显示。

5

enter image description here

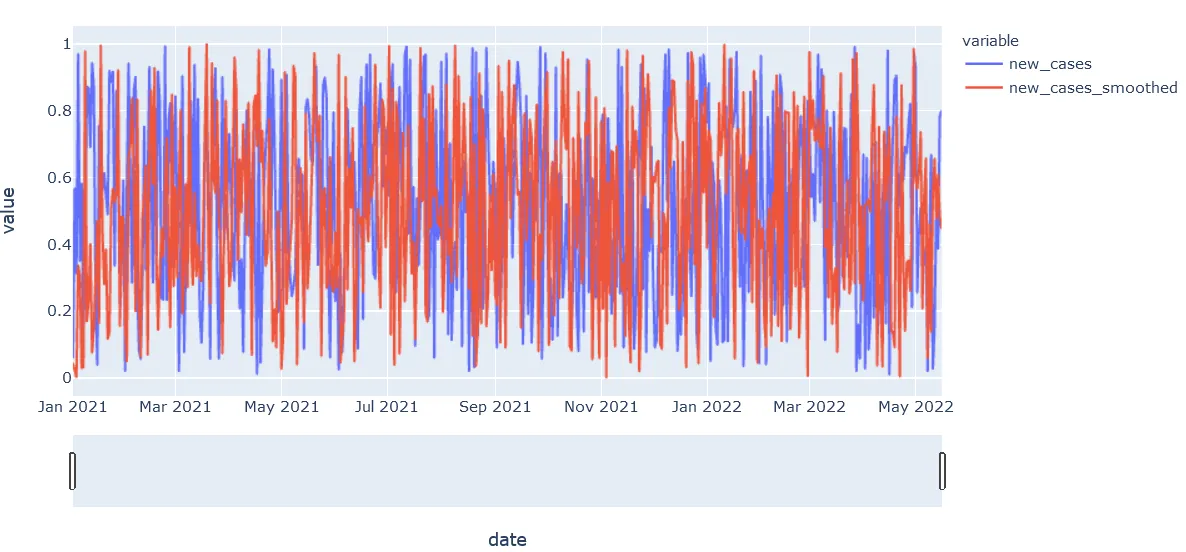
从图像中可以看出,rangeslider的脚手架已经生成,但其内部的轨迹没有显示出来。在某些情况下,只要将行数设置为500或更少,则它就能正确显示。是否有一种方法可以使其在超过该数量的行时仍然能够正常显示?以下是重现代码-

size = 501 #change this to change no. of rows

import numpy as np
import pandas as pd
import plotly.express as px

df = {'date': pd.date_range(start='2021-01-01', periods=size, freq='D'),
     'new_cases': np.random.random(size=size),
     'new_cases_smoothed': np.random.random(size=size)}

df = pd.DataFrame(df)
fig = px.line(df, x='date', y=['new_cases','new_cases_smoothed'])
fig.update_layout(xaxis=dict(rangeslider=dict(visible=True),type="date"))
fig.show()
3个回答

5

对于使用plotly.express的其他人,我设置了参数render_mode='webg1'

size = 501 #change this to change no. of rows

import numpy as np
import pandas as pd
import plotly.express as px

df = {'date': pd.date_range(start='2021-01-01', periods=size, freq='D'),
     'new_cases': np.random.random(size=size),
     'new_cases_smoothed': np.random.random(size=size)}

df = pd.DataFrame(df)
fig = px.line(df, x='date', y=['new_cases','new_cases_smoothed'], render_mode='webg1')
fig.update_layout(xaxis=dict(rangeslider=dict(visible=True),type="date"))
fig.show()

正如@matgc所指出的,这里有一个拼写错误(webg1而不是webgl)。不管render_mode的值是什么,它似乎都能正常工作。有趣的是,render_mode="dummy"也能正常工作...请注意,这也适用于plotly后端直接fig = df.plot(x="date", y=["new_cases", "new_cases_smoothed"], render_mode="dummy") - undefined

2
这在 graph_objects 中有效。
size = 501 #change this to change no. of rows

import numpy as np
import pandas as pd
import plotly.express as px
import plotly.graph_objects as go

df = {'date': pd.date_range(start='2021-01-01', periods=size, freq='D'),
     'new_cases': np.random.random(size=size),
     'new_cases_smoothed': np.random.random(size=size)}

df = pd.DataFrame(df)
# fig = px.line(df, x='date', y=['new_cases','new_cases_smoothed'])
fig = go.Figure(data=[go.Scatter(x=df["date"], y=df[c], name=c) for c in ['new_cases','new_cases_smoothed']])
fig.update_layout(xaxis={"rangeslider":{"visible":True},"type":"date",
                        "range":[df.tail(50)["date"].min(),df.tail(50)["date"].max()]})
fig.show()


谢谢您!我会再等一段时间看是否有关于Plotly Express的答案。如果没有,我会将此标记为答案。 - callmeanythingyouwant

0
有趣的是,您输入了WEBG1而不是WEBGL,它仍然有效。 如果您输入WEBGL,则无法正常工作。 实际上,如果您只输入任何不被视为有效的内容,例如空白(render_mode =''),它也可以正常工作。
真是让人费解...

这不是问题的答案。当您拥有足够的声望时,您可以在帖子下发表评论。请阅读[答案]。 - chrslg
没错,但这个评论仍然有用。我会在热门答案中采纳它。 - undefined

网页内容由stack overflow 提供, 点击上面的
可以查看英文原文,
原文链接