如何在价格图表上自动调整plotly Y轴范围

5

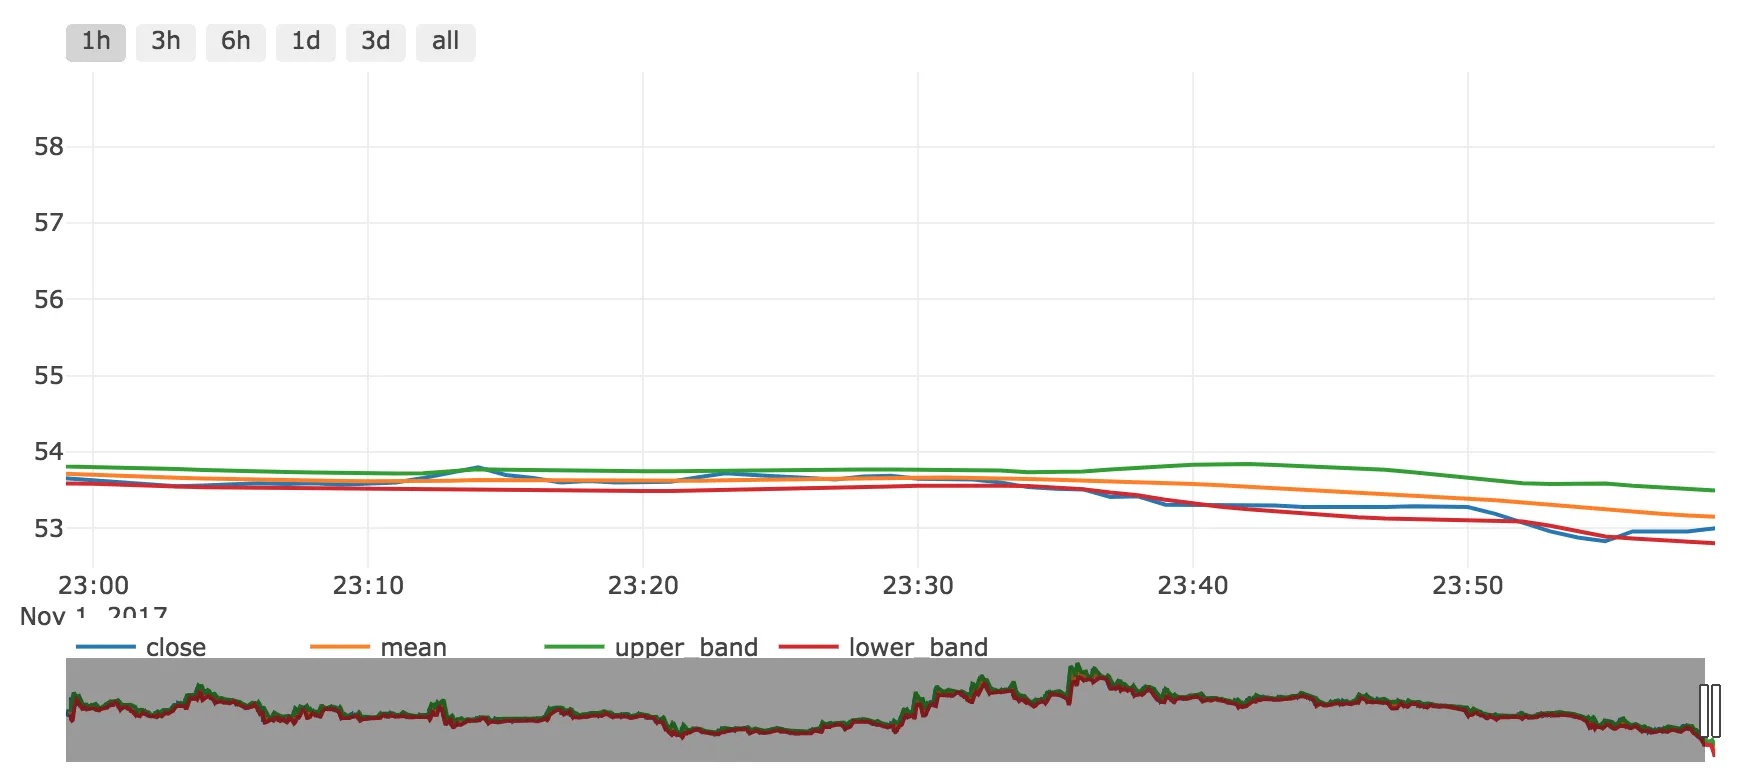
我绘制了一个价格图表。Y轴刻度设置为整个价格范围内的最低和最高价格。
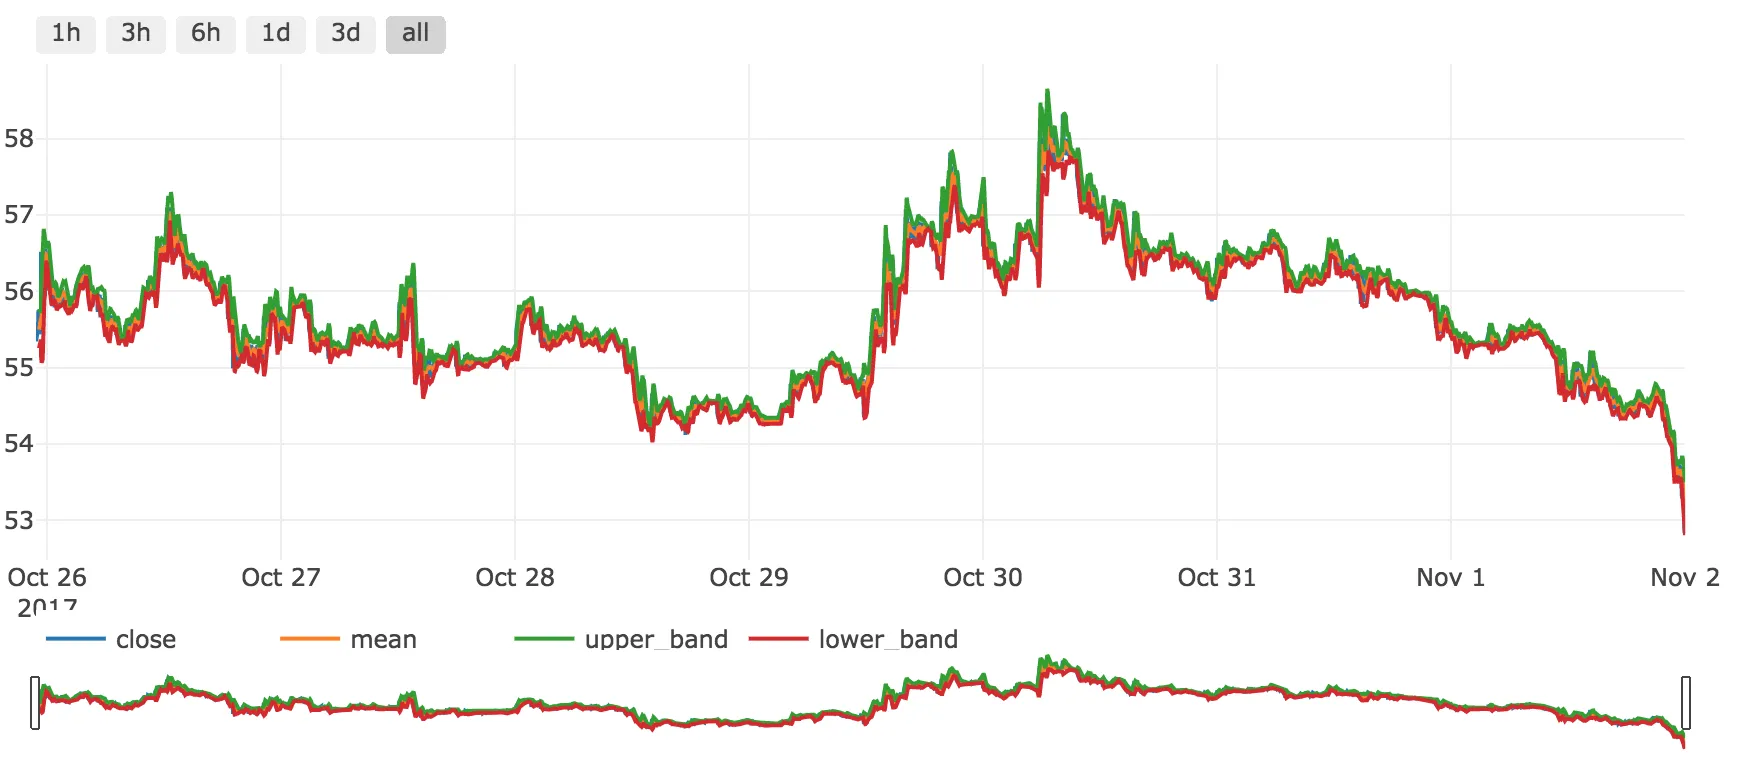
enter image description here

当我减小范围时,例如显示最后一小时时,Y轴不会自动缩放并给出相同的范围。我该如何做到让Y轴自动缩放到可见的价格范围?

enter image description here

这是我的布局

layout = go.Layout(
        title=title,
        legend=dict(orientation="h"),
        xaxis=dict(
            rangeselector=dict(
                buttons=list([
                    dict(count=1,
                         label='1h',
                         step='hour',
                         stepmode='backward'),
                    dict(count=3,
                         label='3h',
                         step='hour',
                         stepmode='backward'),
                    dict(count=6,
                         label='6h',
                         step='hour',
                         stepmode='backward'),
                    dict(count=1,
                         label='1d',
                         step='day',
                         stepmode='backward'),
                    dict(count=3,
                         label='3d',
                         step='day',
                         stepmode='backward'),
                    dict(step='all')
                ])
            ),
            rangeslider=dict(),
            type='date'
        ),
        yaxis=dict(
            title=y_axis_label,
            showticklabels= not seperate_y_axis,
            autorange=True,
            type='linear'
        )
    )

1个回答

4

网页内容由stack overflow 提供, 点击上面的
可以查看英文原文,
原文链接