我有一个名为df的pandas数据框,它有四列:Candidate、Sample_Set、Values和Error。 Candidate列有三个唯一的条目:[X, Y, Z],我们也有三个样本集,因此Sample_Set也有三个唯一的值:[1,2,3]。 df大致如下。
import pandas as pd

data = {'Candidate': ['X', 'Y', 'Z', 'X', 'Y', 'Z', 'X', 'Y', 'Z'],
        'Sample_Set': [1, 1, 1, 2, 2, 2, 3, 3, 3],
        'Values': [20, 10, 10, 200, 101, 99, 1999, 998, 1003],
        'Error': [5, 2, 3, 30, 30, 30, 10, 10, 10]}
df = pd.DataFrame(data)

# display(df)
  Candidate  Sample_Set  Values  Error
0         X           1      20      5
1         Y           1      10      2
2         Z           1      10      3
3         X           2     200     30
4         Y           2     101     30
5         Z           2      99     30
6         X           3    1999     10
7         Y           3     998     10
8         Z           3    1003     10
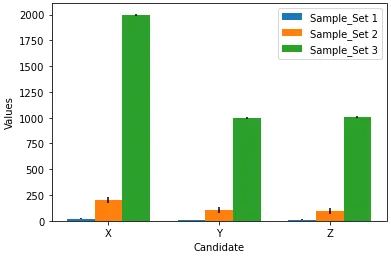
我正在使用seaborn创建一个分组条形图,其中x="Candidate",y="Values",hue="Sample_Set"。一切都很好,直到我尝试在y轴上使用列名为Error下的值添加误差线。我正在使用以下代码。
import seaborn as sns

ax = sns.factorplot(x="Candidate", y="Values", hue="Sample_Set", data=df,
                    size=8, kind="bar")
如何将错误纳入其中?
我希望能得到解决方案或更优雅的方法来完成这个任务。
seaborn通常是matplotlib的扩展,因此无论您在seaborn中无法实现什么,都可以通过使用前者的工具来对输出 (ax) 进行修改。您是否有“误差条”这一术语的视觉示例?您是指 bar plot 吗? - Aleksey Bilogurseaborn通过聚合许多观察值来在barplot中生成这些误差条,而您的数据已经预先聚合了。 - Aleksey Bilogur