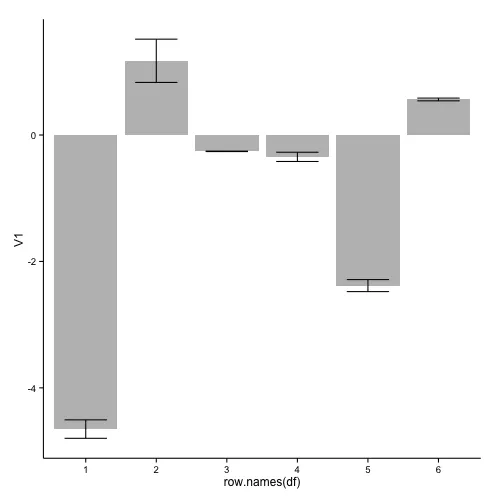
使用ggplot2中的geom_bar和geom_errorbar实现:
library(ggplot2)
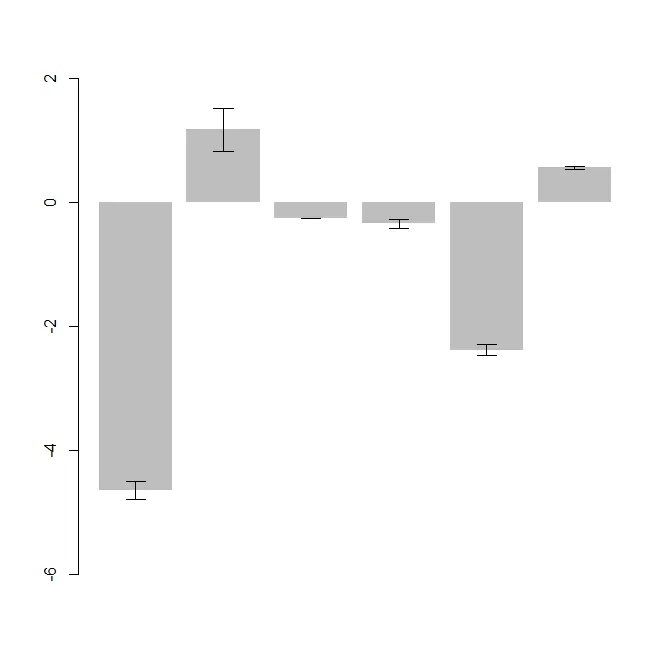
ggplot(df, aes(x=row.names(df), y=V1)) +
geom_bar(stat="identity", fill="grey") +
geom_errorbar(aes(ymin = V1 - V2, ymax = V1 + V2), width=0.6) +
theme_classic()
这将导致:
如果您想要移除x轴上的数字,可以添加如下代码:
  theme(axis.title.x=element_blank(),
        axis.text.x=element_blank(),
        axis.ticks.x=element_blank())
将其添加到您的ggplot代码中。
使用的数据:
df <- read.table(text="-4.6521175 0.145839723
 1.1744100 0.342278694
-0.2581400 0.003776341
-0.3452675 0.073241199
-2.3823650 0.095008502
 0.5625125 0.021627196", header=FALSE)
作为对 你的评论 的回应,当你想绘制如此大量的条形图时,有两种可能的解决方案:
1:仅包含一部分坐标轴标签:
ggplot(df2, aes(x=as.numeric(row.names(df2)), y=V1)) +
  geom_bar(stat="identity", fill="grey", width=0.7) +
  geom_errorbar(aes(ymin = V1 - V2, ymax = V1 + V2), width=0.5) +
  scale_x_continuous(breaks=c(1,seq(10,200,10)), expand=c(0,0)) +
  theme_classic() +
  theme(axis.text.x=element_text(size = 6, angle = 90, vjust = 0.5))
这将给出:
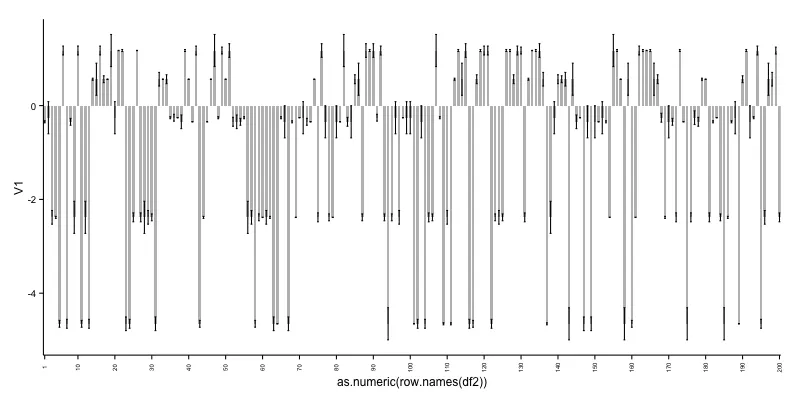
可以看出,在图表中塞入太多的条形并不理想。因此,请参考备选方案2。
2:创建一个分组变量,可用于创建小面板:
df2$id <- rep(letters[1:20], each=10)

ggplot(df2, aes(x=as.numeric(row.names(df2)), y=V1)) +
  geom_bar(stat="identity", fill="grey", width=0.7) +
  geom_errorbar(aes(ymin = V1 - V2, ymax = V1 + V2), width=0.5) +
  scale_x_continuous(breaks=as.numeric(row.names(df2))) +
  facet_wrap(~ id, scales = "free_x") +
  theme_bw() +
  theme(axis.text.x=element_text(angle = 90, vjust = 0.5))
这将给出:
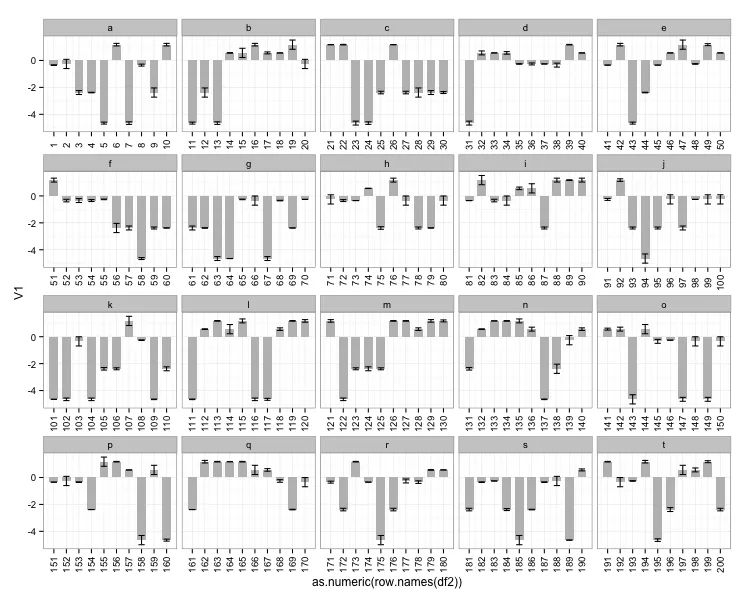
使用了最后两个示例的数据:
df2 <- data.frame(V1=sample(df$V1, 200, replace=TRUE),
                  V2=sample(df$V2, 200, replace=TRUE))
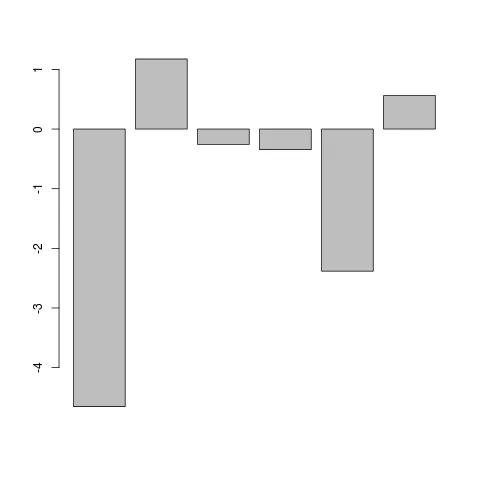
arrows()中的length参数(并在barplot()中使用border=NA来美化问题)。 - Stephan Kolassa