使用 Sympy 绘制 3D 曲线

5
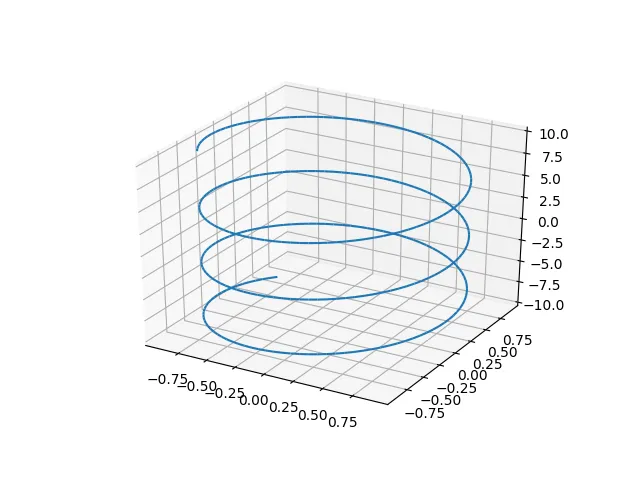
如何使用Sympy绘制以下3D曲线(以此为例)?我知道只需为t创建一个数组并在Matplotlib中执行此操作,但我实际上不想绘制这个曲线,而是想学习如何符号性地定义和绘制曲线。

alpha(t) = (cos(t), sin(t), t)

from sympy import *

t = symbols('t')
alpha = [cos(t), sin(t), t]

# now what?

我尝试了多种方法使用plot函数,但结果要么只得到三条分离的一维曲线,要么就是出现错误。


请先学习这个http://docs.sympy.org/latest/modules/plotting.html。 - swatchai
2个回答

8

您需要使用来自sympy.plotting的方法,对于您的情况,您需要使用plot3d_parametric_line

from sympy import *
from sympy.plotting import plot3d_parametric_line

t = symbols('t')
alpha = [cos(t), sin(t), t]
plot3d_parametric_line(*alpha)

如果您想设置t的限制,请使用plot3d_parametric_line(cos(t), sin(t), t, (t, 0, 2*pi))

enter image description here 在sympy中查找更多的三维绘图示例:https://github.com/sympy/sympy/blob/master/examples/beginner/plot_examples.py


2

我从未尝试在sympy中绘制图表

我怀疑更多人会有matplotlib的经验

lambdify()是符号表达式和常规函数之间的接口

from sympy import *
from sympy.utilities.lambdify import lambdify
import math

t = symbols('t')
alpha = [cos(t), sin(t), t]

f = lambdify(t, alpha)

T = [2*math.pi/100*n for n in range(100)]
F = [f(x) for x in T]

import matplotlib.pyplot as plt
import mpl_toolkits.mplot3d.axes3d as axes3d

fig1, ax1 = plt.subplots(subplot_kw=dict(projection='3d'))
ax1.plot(*zip(*F))
ax1.set_aspect('equal')
plt.show()

enter image description here


很遗憾,这个答案已经过时了。alpha的定义导致了一个错误AttributeError: 'Zero' object has no attribute 'cos'。当alpha = [2*t, 3*t, t]时,倒数第二行会导致NotImplementedError: It is not currently possible to manually set the aspect on 3D axes,这在这里有描述。 - claudio

网页内容由stack overflow 提供, 点击上面的
可以查看英文原文,
原文链接