在DataFrame上绘制多个图形的方法

3

我有以下数据框:

    Food               Men     Women    Year
0   Apples as fruit    89.18    90.42   1994
1   Berries            84.21    81.73   1994
2   Grapes             88.79    88.13   1994
3   Melons             80.74    84.96   1994
4   Oranges, Total     85.66    89.77   1994
5   Other citrus fruit 79.82    80.64   1994
6   Stone fruit        88.95    89.55   1994
7   Tropical fruit     74.61    80.40   1994
8   Apples as fruit    90.86    91.21   1994
9   Berries            88.57    88.29   2004
10  Grapes             88.55    90.14   2004
11  Melons             79.72    80.99   2004
12  Oranges, Total     84.46    88.07   2004
13  Other citrus fruit 73.74    69.60   2004
14  Stone fruit        94.02    87.94   2004
15  Tropical fruit     74.58    85.85   2004

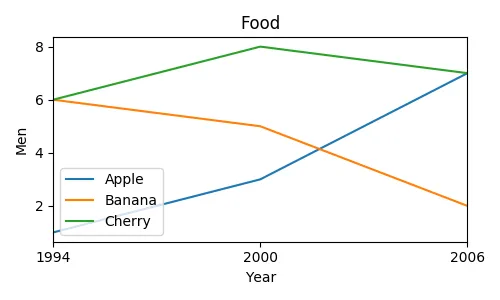
我正在尝试创建一个水果与年份或时间的折线图,以食品作为不同的线条颜色。参考这里的答案并使用groupby,我尝试了以下操作:

for i, group in fruits.groupby('Food'):
   plt.figure()
   group.plot(x='Year', y='Men', title=str(i))

但这样会生成8条只有一条线的图,或者每个水果都有一张图。我希望得到一张图,每个水果都有不同的线条。如何使用pandas、matplotlib或numpy实现这个功能?此外,年份列目前是一个整数,所以绘图包括了像1996年、1998年、2000年等我没有数据的年份。我希望它是一个范围,比如1993-1994或2003-2004。有没有办法省略它们?
1个回答

2
您需要在循环之外创建这个图形。然后最好使用ax关键字参数向Dataframe绘图提供一个matplotlib轴。
import pandas as pd
import matplotlib.pyplot as plt

year=[1994,1994,1994,2000,2000,2000,2006,2006,2006]
fr = ["Apple", "Banana", "Cherry"]*3
men = [1,6,6,3,5,8,7,2,7]
fruits =pd.DataFrame({"Year" : year, "Food" : fr, "Men" : men})

fig, ax = plt.subplots()
for i, group in fruits.groupby('Food'):
    group.plot(x='Year', y='Men', ax=ax, label=group["Food"].iloc[0])
ax.set_title("Food")
ax.set_ylabel("Men")
#optionally only set ticks at years present in the years column
ax.set_xticks(fruits["Year"].unique())

plt.show()

enter image description here


网页内容由stack overflow 提供, 点击上面的
可以查看英文原文,
原文链接